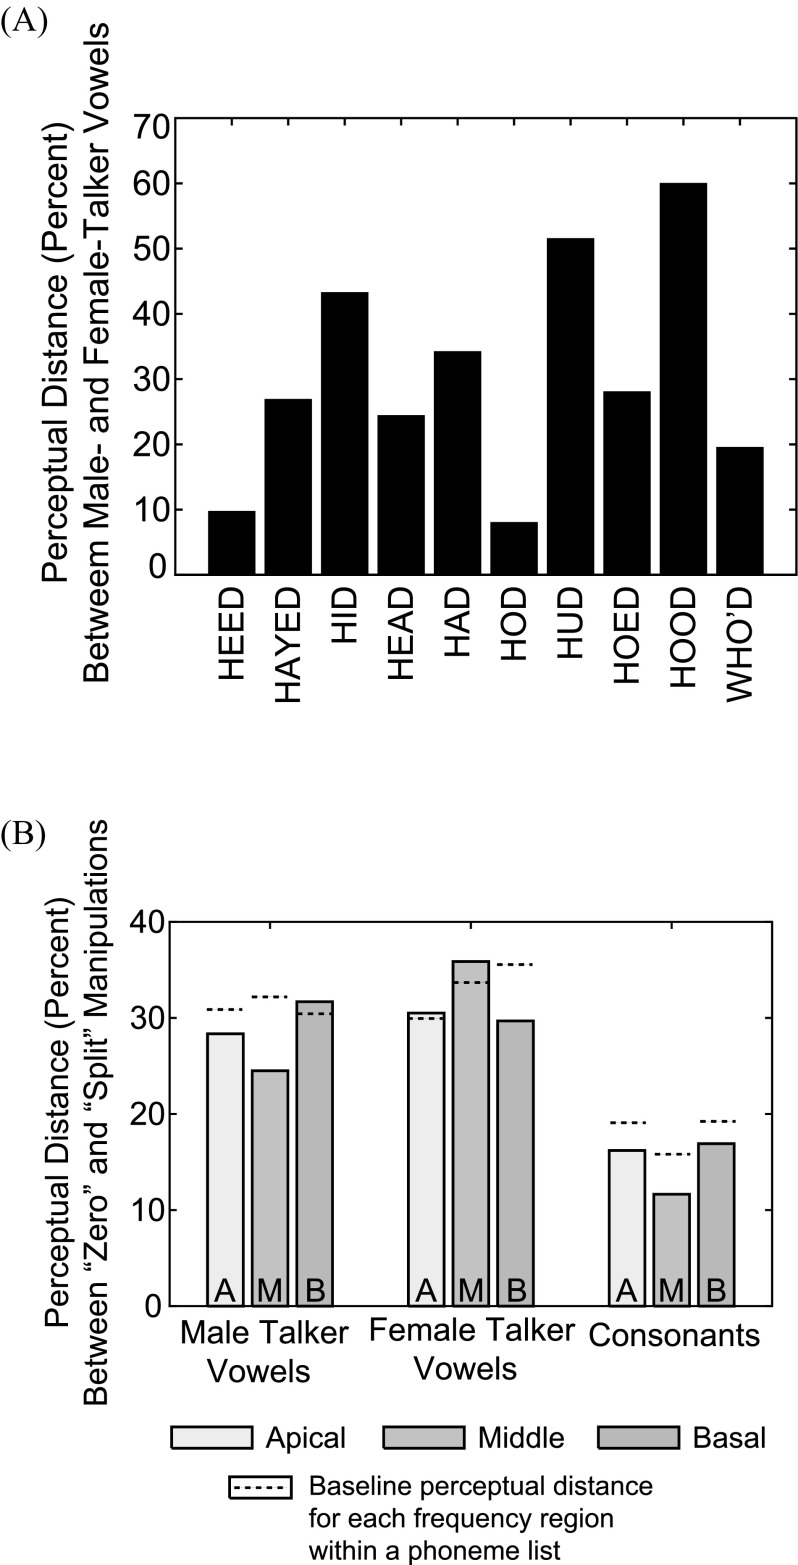
FIG. 8.
(Color online) Perceptual distance results. (A) Male and female talker vowels. Results shown are from the all channels control condition and were averaged across subjects. Each bar represents one vowel and the height of the bar indicates the perceptual distance for that vowel between talkers, in percent. (B) Zero and split conditions. Results were averaged across phonemes within a list and subsequently across subjects. Bars are grouped by phoneme list. Bar height indicates the perceptual distance in percent between the two vocoder manipulation types. The dashed line within or above each bar indicates the baseline within-subject perceptual distance between the zero and split manipulations for that particular frequency location and phoneme list.

