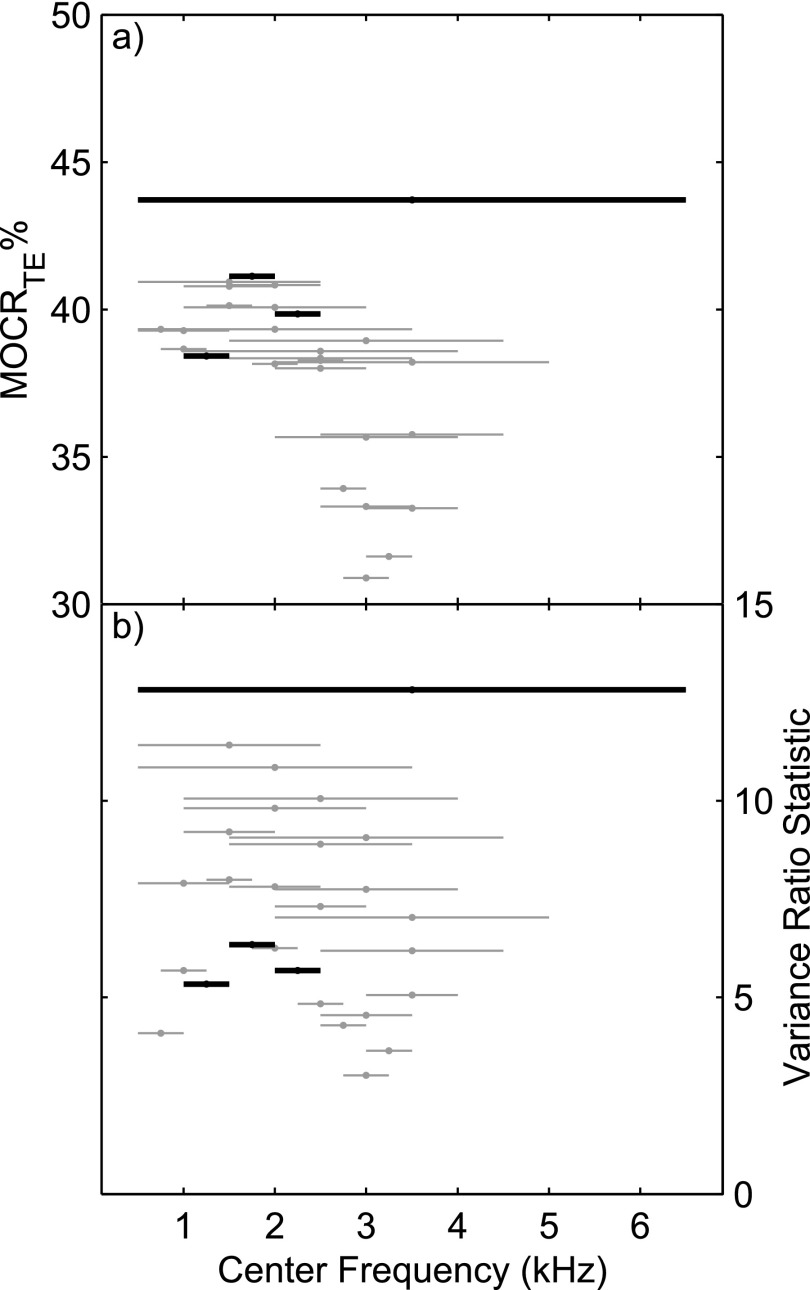
FIG. 5.
(a) MOCRTE strength and (b) MOCR variance ratio statistic for various analyzing bandwidths and center frequencies. The width of each line indicates the bandwidth and its position on the abscissa indicates the center frequency. The height of the line indicates the (a) MOCR% or (b) variance ratio. The four bands used in the other analyses are indicated in black. Conditions with insufficient data are not plotted. The MOCR variance ratio (an indicator of test performance) is not directly related to those conditions producing higher MOCR strength. Best performance is for wider bands and for bands that include the lower frequencies.

