
Fig. 1. Volcano plot showing the significance and magnitude of autosomal DNA methylation changes associated with cow's milk allergy (CMA).
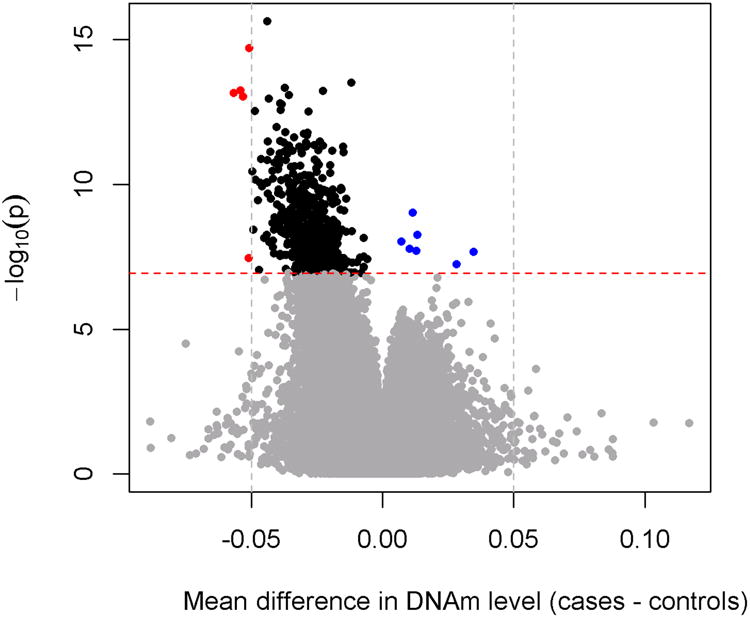
Mean differences in DNA methylation (cases-controls) are plotted on the x-axis and corresponding -log10(p-value)s are plotted on the y-axis. Each point represents a measured CpG site. Black and blue points represent CpG sites significantly hypomethylated and hypermethyated in CMA cases, respectively. Red points represent those significant CpG sites with DNA methylation difference >5% between cases and controls. The red dashed horizontal line represents the genome-wide significance threshold (p=1.15E-07).