
Fig. 1.
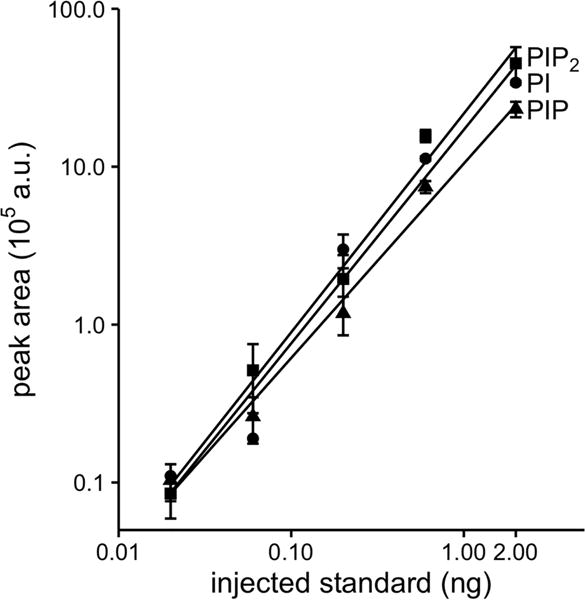
Calibration curves shown as responses to analytical internal standards for 37:4 PI, PIP, and PIP2 spiked into 106 tsA201 cells. Cells combined with internal standards were extracted and derivatized. Different quantities of extract were injected, specified as nanograms of the standard actually injected onto the C4 UPLC column. We used post-column sodium infusion (50 μM at 5 μl/min) and monitored the effluent with the Waters Xevo TQ MS/MS run in MRM mode using the fragmentation transitions identified in Fig. S3. (n = 3)