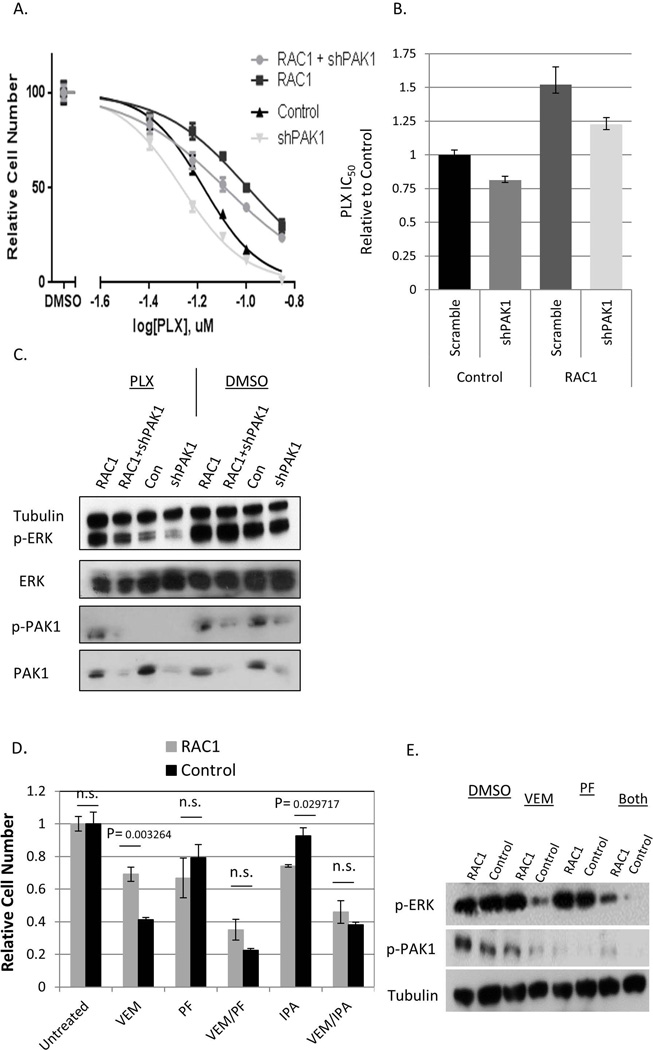
Figure 1. The effects of inhibition of PAK on RAC1-mediated resistance to BRAFi.
(A) A375 cells were transduced with RAC1 P29S and shPAK1 (“RAC1+shPAK1”), pLX304 empty vector and shPAK1 (“shPAK1”), RAC1 P29S and a non-targeting “scrambled” shRNA (“RAC1”), or pLX304 and a “scrambled” shRNA (“Control”). The cells were treated for five days with the indicated doses of PLX4720 in quadruplicates, and the numbers of remaining cells were compared by methylene blue staining extraction method. The values with standard deviations are plotted as percentages of those in the corresponding cultures treated with the vehicle (DMSO) alone. (B) The IC50 concentrations were calculated for the data shown in (A) and are presented relatively to that of the “Control” culture. The error bars denote 95% confidence intervals. (C) The indicated cell lines were treated with 100nM PLX4720 or DMSO, and the corresponding lysates were probed by immunoblotting for the expression total and activated (phosphorylated) PAK1 and ERK1/2, as well as α-tubulin (loading control). (D) A375 cells transduced with RAC1-P29S (“RAC1”) or pLX304 (“Control”) were treated for 5 days with 50nM vemurafenib (“VEM”), 2.5uM IPA3 (“IPA”) or 10nM PF3758309 (“PF”), alone or in the indicated combinations. The numbers of remaining cells were compared using the methylene blue straining and extraction method and are shown as a fraction of the values in the corresponding “Untreated” (exposed to DMSO alone) cultures. (E) The lysates from the cells treated for 48h as in (D) were probed by immunoblotting for the levels of α-tubulin (loading control) and the activated (phosphorylated) forms of PAK1 and ERK1/2.

