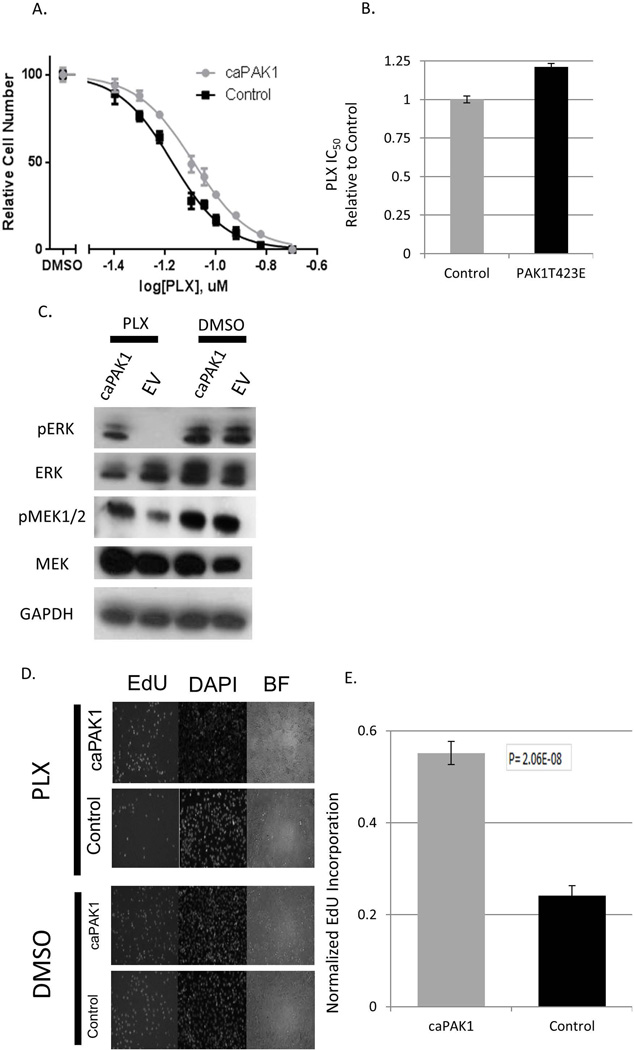
Figure 2. Constitutive activation of PAK1 reduces the effects of BRAF inhibition.
(A) A375 cells transduced with PAK1 T423E (“caPAK1”) or the corresponding empty vector (“Control”) were treated in quadruplicates with the indicated doses of PLX4720. The numbers of remaining cells were compared using the methylene blue staining and extraction method. The values with standard deviations are plotted as percentages of those in the corresponding cultures treated with the vehicle (DMSO) alone. (B) The IC50 concentrations were calculated for the data shown in (A) and are presented relatively to that of the “Control” culture. The error bars denote 95% confidence intervals. (C) A375 cells transduced with PAK1 T423E (“caPAK1”) or the corresponding empty vector (“EV’) cells were treated for 48h with 60nM of PLX4720 or the corresponding vehicle (DMSO) alone. Cell lysates were probed by immunoblotting for GAPDH (loading control) and total and activated (phosphorylated) MEK1/2 and ERK1/2. (D) A375 transduced with caPAK1 or the corresponding empty vector (“Control”) were treated for 48h with PLX4720 or DMSO. EdU (10uM) was added and 1h later the cells were then stained as described in Materials and Methods. Representative images are shown. (E) For the cells treated as in (D), the fraction of EdU-labeled cells was scored on 5 randomly chosen fields of view. The bars show the values for PLX470-treated cultures as a fraction of the corresponding DMSO-treated controls. The error bars represent standard deviations.

