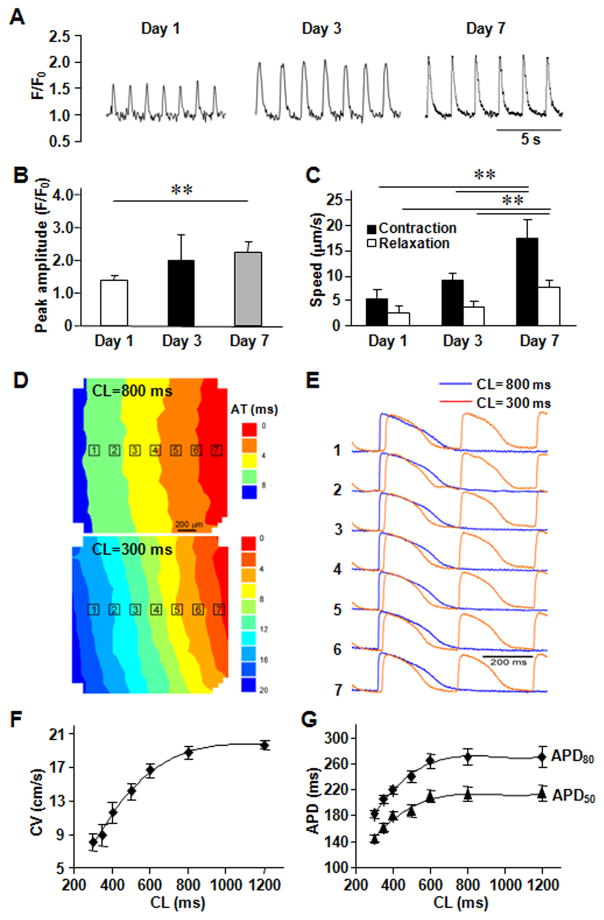
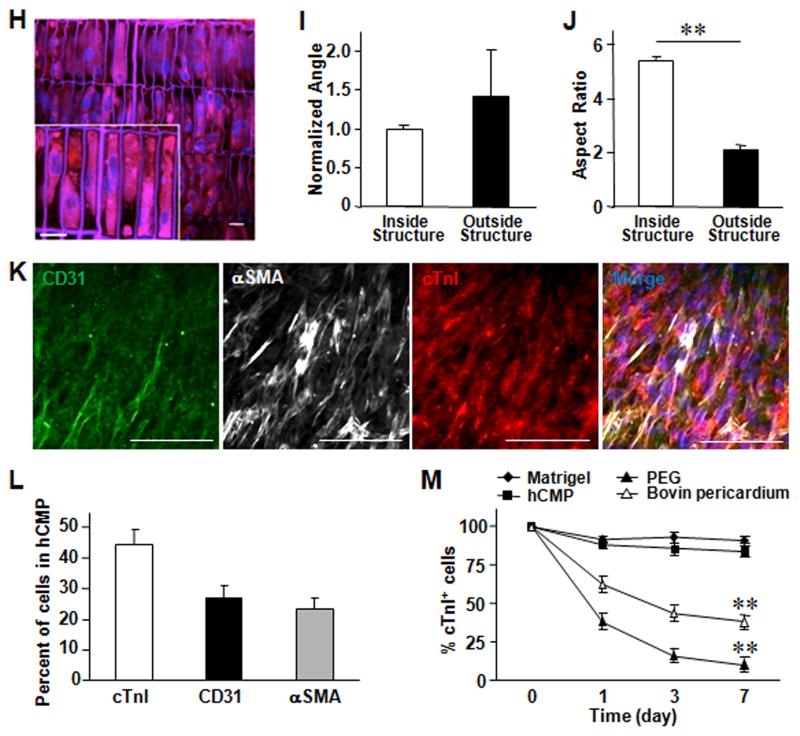
Figure 2. In vitro assessments of the hCMP.
(A) Calcium transients were recorded in hCMPs on day 1, 3, and 7 after cell seeding, and used to calculate the (B) peak amplitude (F/F0; n ≥ 50 cells per time point). (C) Videos of the beating hCMPs were taken on day 1, 3, and 7 and evaluated with motion vector analysis software to calculate the speeds of contraction and relaxation (n=4 hCMPs per time point). (D–G) Action potential propagation in hCMP was measured on day 7 (n=4). (D) Representative isochronal map of activation spread and (E) selected optical Vm traces recorded during pacing with cycle length (CL) of 800 and 300 ms. AT, activation time; Dependence of (F) conduction velocity (CV) and (G) action potential duration (APD50 and APD80) on pacing CL. (H) hCMPs were stained with DAPI on day 7; then, autofluorescence images were obtained via 2-photon microscopy (scale bar = 20 μm) and used to calculate the cells’ (I) angle of alignment relative to the long axis of the engineered channel and (J) aspect ratio. (K) On day 7, ECs, SMCs, and CMs were identified in the hCMPs via immunofluorescence staining for the presence of CD31, α-smooth-muscle actin (αSMA), and cardiac troponin I (cTnI), respectively; then (L) the proportion of each cell type was calculated (5 fields per hCMP and 4 hCMPs). (M) Known quantities of hiPSC-CMs were seeded into Matrigel, polyethylene glycol (PEG), decellularized bovine pericardium, or the engineered scaffold and cultured for 7 days; then, the cells were immunofluorescently stained for cTnI expression, and cell survival was quantified as the ratio of the number of cTnI+ cells observed to the number of seeded cells. **P<0.01.


