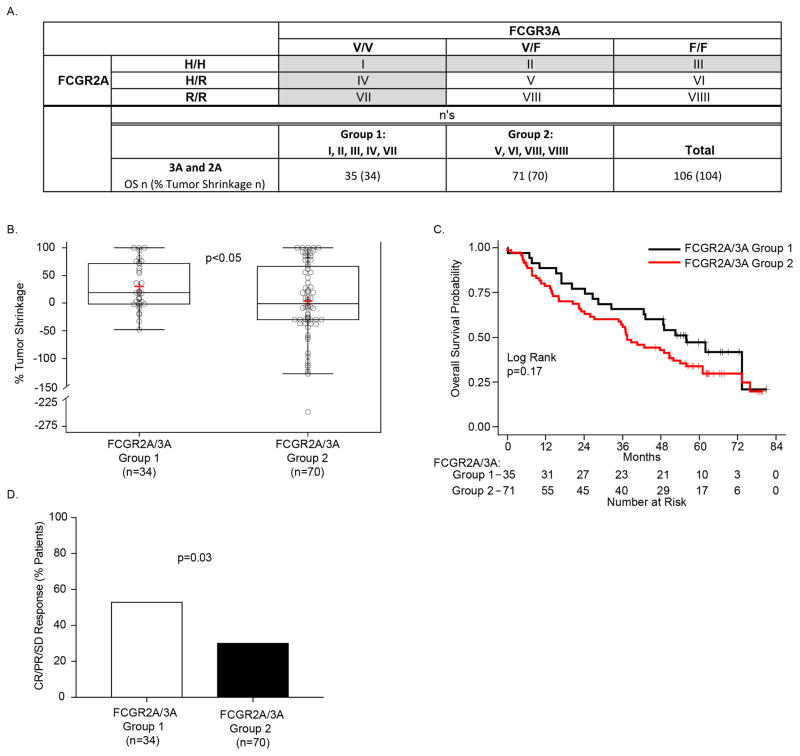
Figure 1. FCGR2A and FCGR3A higher-affinity genotypes resulted in improved % tumor shrinkage.
A) The 3 separate genotypes for FCGR3A (V/V, V/F and F/F), when combined with the 3 separate genotypes for FCGR2A (H/H, H/R and R/R), yield 9 separate genotypes, each in a separate box designated: I–VIIII. Those patients with homozygous expression of either V/V or H/H (cells I, II III, IV, and VII) are included in Group-1 (n=35 patients for OS, n=34 for % Tumor Shrinkage), all remaining patients (neither V/V nor H/H) are included in Group-2 (n=71 patients for OS, n=70 for % Tumor Shrinkage). B) Patients in Group-1 (homozygous for either V/V or H/H) show a significant increase in the % tumor shrinkage as compared to those in Group-2 (not homozygous for either V/V or H/H). C) OS for Group-1 was prolonged vs. that for Group-2, although not significant.

