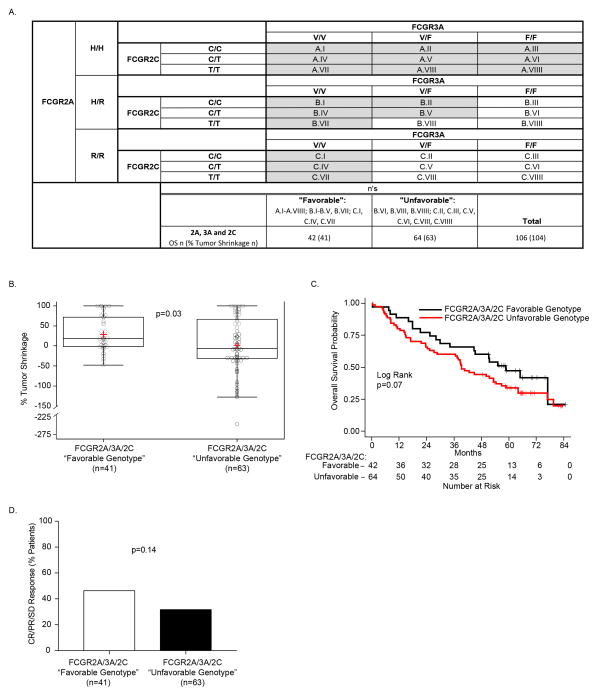
Figure 3. The combination of FCGR2A, FCGR3A and FCGR2C SNPs is associated with % tumor shrinkage and OS.
A) The 3 separate genotypes for FcgR3a (V/V, V/F and F/F), when combined with the 3 separate genotypes for FCGR2c (C/C, C/T and T/T) yield 9 separate genotypes. Here these are combined with the 3 separate genotypes for FcGR2A: H/H (upper panel); H/R (center panel); and R/R (lower panel). When genotypes for all 3 of these loci are combined (27 separate boxes), we divided them into favorable (shaded in Fig. 3A) vs. unfavorable (unshaded) genotypes. The favorable group includes all patients homozygous for H/H or V/V, as well as patients heterozygous for H/R if also expressing V/V or at least one copy of FCGR2C-”C”, and patients negative for H (ie: R/R patients) if they are V/V homozygotes, corresponding to 42 patients for OS, 41 patients for % Tumor Shrinkage. All others, namely those patients that do not have at least 2 copies of either high affinity allele (F/F-R/R, V/F-R/R or F/F-H/R), and those patients heterozygous for V/F and H/R but lacking any expression of FCGR2C are unshaded and labeled as unfavorable (n=64 patients for OS, n=63 patients for % Tumor Shrinkage). B) Patients with a favorable genotype show improved % tumor shrinkage as compared to those in the unfavorable group (p=0.03). C) This predominance of patients with favorable genotype (red) vs. unfavorable genotype (blue) amongst those with tumor shrinkage is also seen in the right side of the waterfall plot for % tumor shrinkage for all 105 patients evaluable for this analysis. D) A trend towards better OS was also seen for patients with favorable genotype (p=0.07)

