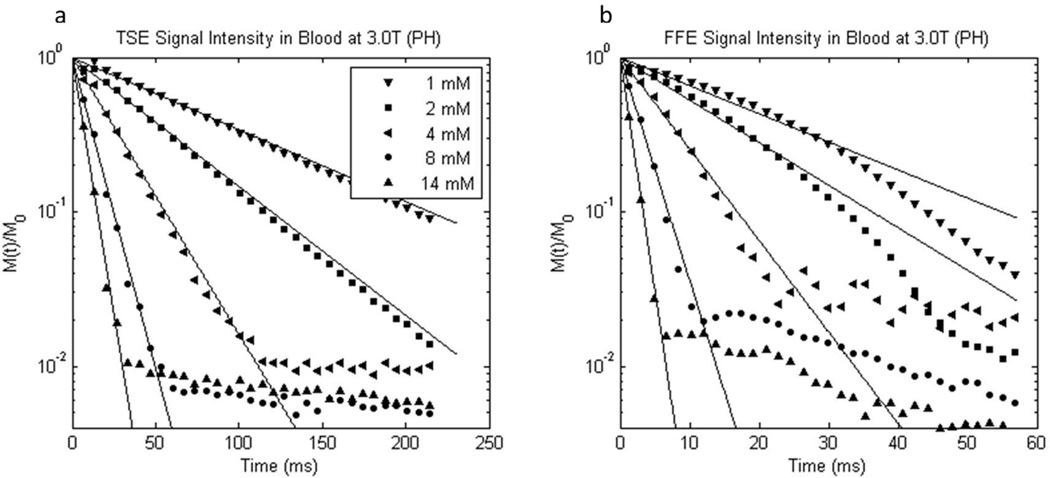
Figure 3.
Semilogarithmic plots of representative experimental 3.0 T a) turbo spin echo and b) free-induction 1H2O signal decays from oxygenated whole blood samples containing different gadoteridol (PH) concentrations. Note the different abscissa scales. The mM concentration values indicated have units mmol(gadoteridol) per liter(whole blood). Mono-exponential fittings are represented by solid lines.

