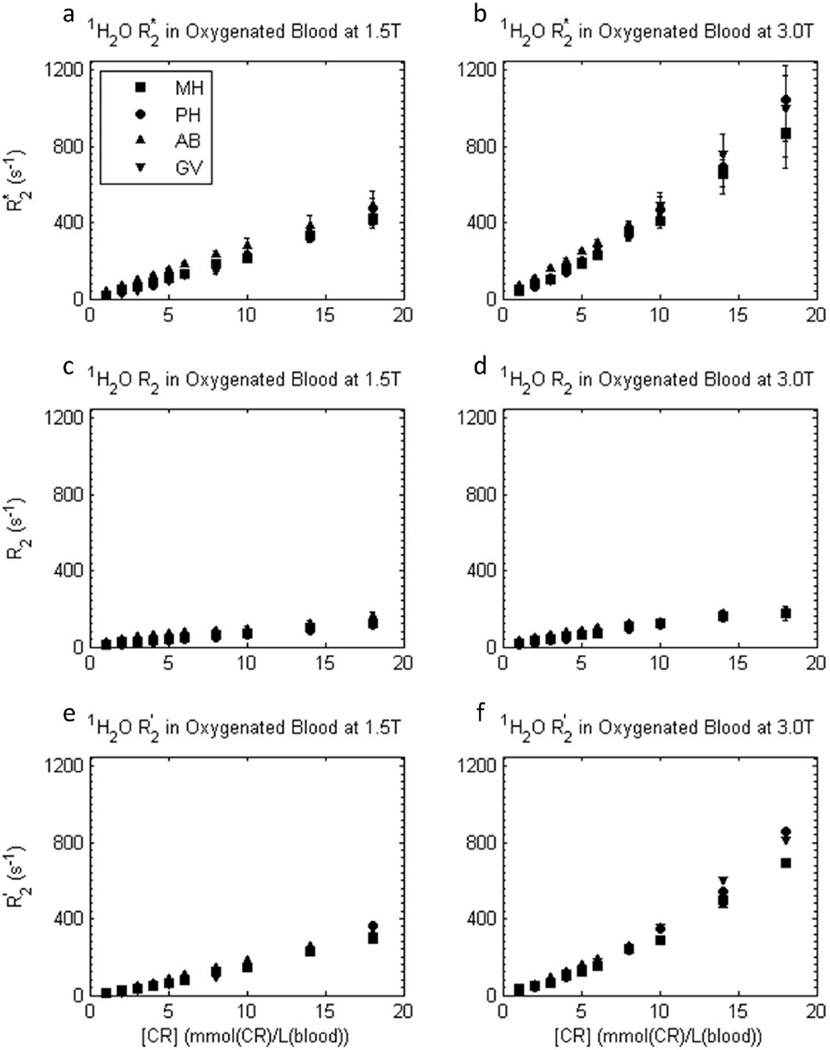
Figure 5.
[CRb]-dependence of experimental transverse 1H2O relaxation R2* (a,b), R2 (c,d), and R2′ ([≡ R2* - R2]; e,f) rate constants in oxygenated whole blood samples at 1.5 T (a,c,e) and 3.0 T (b,d,f), for four different CRs. Here, blood concentrations, [CRb], are used. Error bars in R2* and R2 data represent fitting confidence intervals (these are often no larger than the points). In blood, the transverse relaxivities are similar for all four CRs. R2* is approximately doubled at 3.0 T vs. 1.5 T, and R2′ provides a large fraction of R2*.

