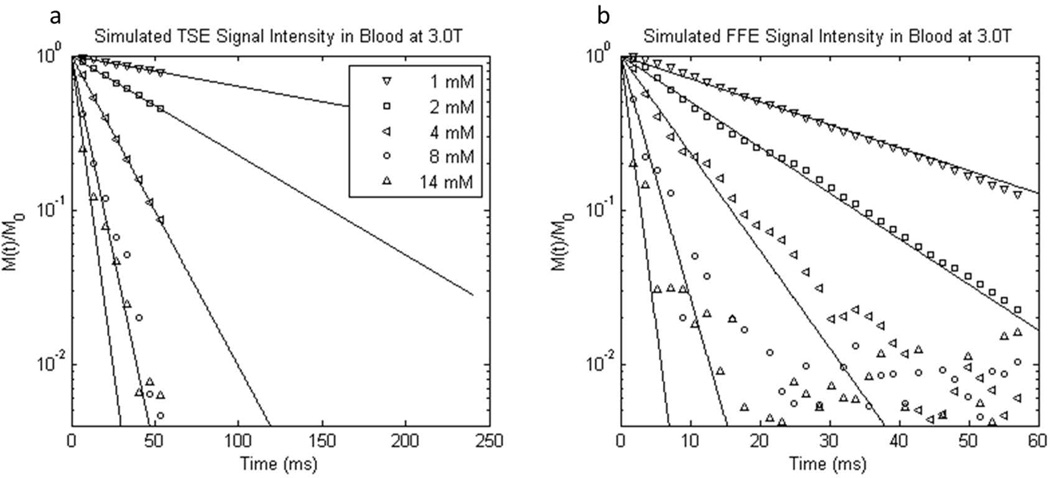
Figure 7.
Semilogarithmic plots of representative simulated 3.0 T a) turbo spin echo and b) free-induction 1H2O signal decays from randomly oriented oxygenated blood cell ensembles containing different GBCR concentrations (simulated χe is the same for all GBCRs). Note the different abscissa scales. The mM concentration values have units mmol(CR) per liter(whole blood). Mono-exponential fittings are represented by solid lines. The simulated signal intensities are vector sums of proton spins from 13,000 Monte Carlo simulations. The decays are discretized by sub-sampling. Though the simulations were of only 60 ms duration, the spin echo fittings (a) are plotted out to 240 ms, for comparison with the experimental data (Fig. 3).

