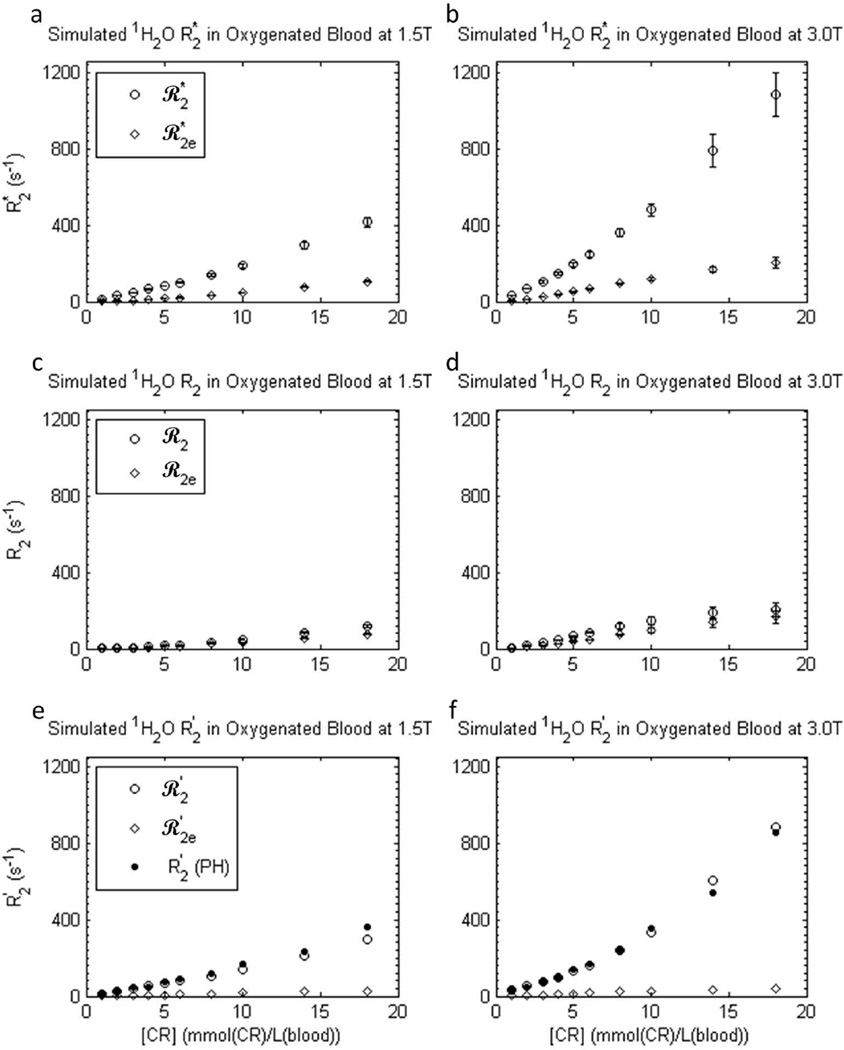
Figure 8.
Simulated transverse 1H2O relaxation rate constants ℛ2* (a,b), ℛ2 (c,d), and ℛ2′ [(≡ℛ2* - ℛ2); e,f] for an ensemble of randomly oriented oxygenated blood cells at 1.5 T (a,c,e) and 3.0 T (b,d,f) as functions of GBCR concentration: here, blood concentration, [CRb]. Error bars in ℛ2* and ℛ2 results represent fitting confidence intervals (these are often no larger than the points). Rate constants were predicted using both extracellular field inhomogeneities and intracellular BMS frequency differences (open circles), and only extracellular inhomogeneities (open diamonds). The experimental R2′ values for gadoteridol (Fig. 5 circles) are re-plotted in e-f (filled circles) to show the remarkable agreement of ℛ2′ with R2′ when both dephasing contributions are included. Simulation details are given in the text: there are no adjustable parameters. Simulations using only the extracellular field inhomogeneities (open diamonds) resulted in ℛ2e dephasing, but very little ℛ2e′.

