Fig. 4.

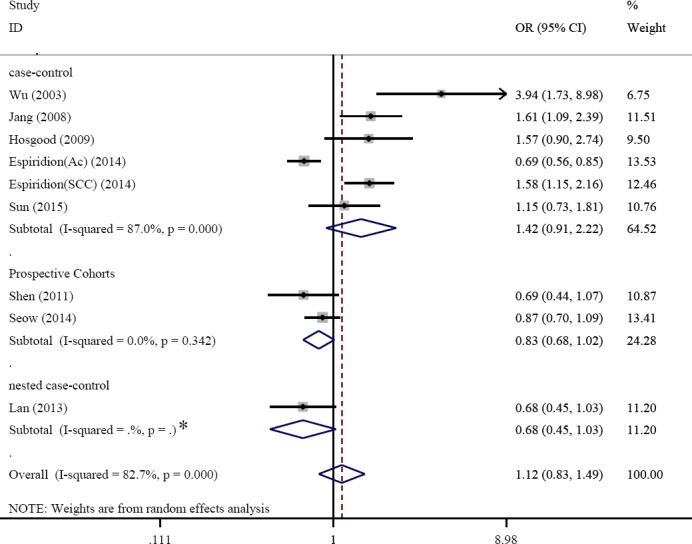
Forest plot of the subgroup analyses stratified by type of studies (case- control, nested case- control and prospective cohorts). *One study selected, therefore P-values wasn’t calculated.

Forest plot of the subgroup analyses stratified by type of studies (case- control, nested case- control and prospective cohorts). *One study selected, therefore P-values wasn’t calculated.