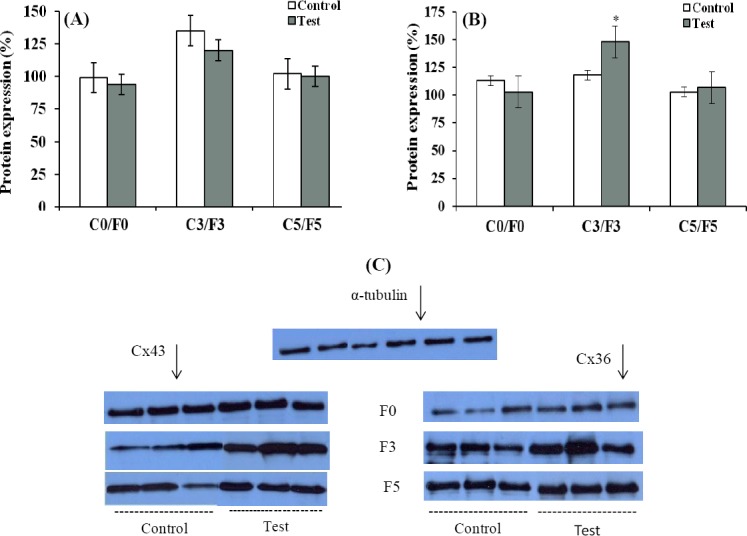
Fig. 1.

The protein abundance of connexins in the hippocampus of pilocarpine-treated rats. (A) Connexin 36; (B) Connexin 43. F0, after status epilepticus; F3, after development of focal seizures; F5, after acquisition of generalized seizures. C0, C3, and C5 are control time points matched to F0, F3, and F5, respectively. Cx36 and Cx43 protein levels were normalized to the level of α-tubulin protein. Data are expressed as means±S.E.M (n=6). Panel C shows representative immunoblots of Cx43 and Cx36 in the groups. *P<0.01 compared to F0 and F5 test subgroups.
