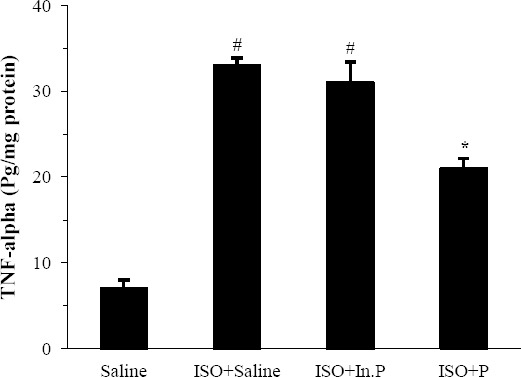
Fig. 6.

TNF-α levels in rats pretreated with Saline, ISO+saline, ISO+In.P, and ISO+P. Values are mean±SEM. #P<0.01 from respective saline value; *P<0.01 as compared with ISO+saline and ISO+In.P groups. In.P, inactivated probiotics; P, probiotics; ISO, isoproterenol
