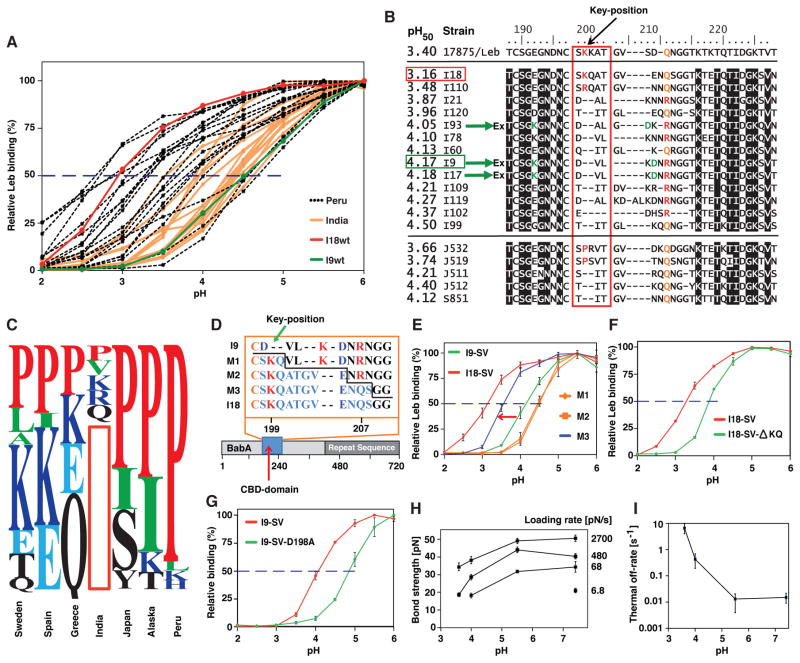
Figure 5. Acid Inactivation of Leb Binding Depends on the pH Response-Sensor in the Key-Coil.
(A) pHgrams of 17 Asian Indian and 20 Peruvian strains with acid-resistant Indian I18 shown in red and more acid-sensitive Indian I9 shown in green.
(B) BabA sequences from 17875/Leb, the Asian-Indian strains (I), and strains from Japan (J) and Spain (S) with/without Key-coil positions 199 and 200 ranked according to their pH50. A red vertical box indicates the Key-coil. The acid-resistant strain I18 (horizontal red box) and acid-sensitive strain I9 (horizontal green box) are indicated. The three green arrows show strains that carry the K192/D205 Exceptional (Ex) motif for increased acid sensitivity in binding (similar to Ex motif in Figure 3C).
(C) The prevalence of P in the Key-position is ~25% in Europe, ~50% among North American Amerindians (Alaska), and ~90% among South American Amerindians (Peru) (Table S2). The red vertical box illustrates the missing Key-position in most Indian strains.
(D) The three I9-SV BabA mutants (M) with 3, 8, or 11 amino acids from the Key-coil region of strain I18.
(E) pHgrams show that BabA I9 with the S198–S208 (11 aa) segment, expressed in H. pylori strain P1ΔbabA, gave strain M3 a 60% increase in acid resistance (arrow) compared to the original I9 strain (pH50 4.17). M3 pH50 = 3.56 (blue), whereas the M1 and M2 mutants (orange) showed contrasting increased acid sensitivity (pH50 = 4.46) (means ± SD for n = 5 (M1), n = 6 (M2 and M3), or n = 3 (I9 and I18) individual clones).
(F) Recombinant expression of BabA I18-SV and I18-SV- KQ in H. pylori strain P1ΔbabA, demonstrated increased acid sensitivity from pH50 3.3 to 3.9 (means ± SD for n = 4) due to deletion of the two residues 199K and 200Q.
(G) Recombinant expression of BabA I9-SV and I9-SV-D198A in H. pylori strain P1ΔbabA demonstrated increased acid sensitivity from pH50 = 4.1 to 4.9 (means ± SD for n = 4) due to inactivation of the salt bridge’s D-node by the D198A substitution.
(H) Bond strengths for twelve combinations of acidity and loading rate. These are the effective loading rates for the binding when the influence of the elasticity of the bacterium body has been compensated for (Bell, 1978).
(I) The off-rate was assessed by a linear fit of the measured bond strength versus the logarithm of the loading rate (from H), where the off-rate is calculated from the slope of this line (Björnham et al., 2009). The measured increase in off-rate (dissociation) is comparable to the decrease in bacterial binding affinity at pH 3.6 (Figure 1D). The results are based on >4000 single measurements.

