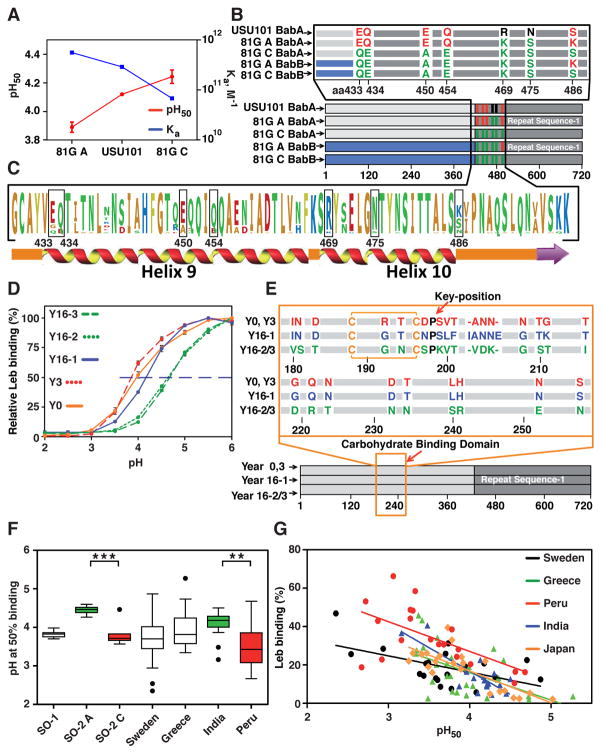
Figure 6. BabA Adaptation in Acid Sensitivity During Severe Disease Progression.
(A) The 81G antrum and 81G corpus clones had pH50 values of 3.9 and 4.25 and Ka values of 6.8 × 10¹⁰ M−1 and 5.6 × 10¹¹ M−1, respectively, compared to 4.15 and 2.9 × 10¹¹ M−1 for the USU101 parent strain.
(B) Amino acid replacements in BabA due to babA/babB recombinations. The 81G corpus and antrum BabAs had six and three amino acid substitutions, respectively, compared to USU101 (Figure S6G).
(C) UniProt alignment of 98 BabA Velcro Domain sequences with the seven 81G substitutions indicated.
(D) pHgrams of H. pylori isolated from the GC-patient at Year (Y)0, Y3, Y16-1, Y16-2, and Y16-3 (means ± SD, n = 2).
(E) BabA alignment of the Y0/Y3 (identical) isolates, the Y16-1 isolate, and the more acid-sensitive Y16-2/3 (identical) isolates, where all but one substitution (aa343) are located in the CBD (in red, blue, and green, respectively, see panel D).
(F) Box plots of pH50 for 26 SO-1 (non-reflux dyspepsia) isolates, 20 SO-2 (gastric reflux) antrum (A) and 10 SO-2 corpus (C) isolates (Figure 3A), and 21 Swedish (Figure 2A), 30 Greek (Figure S4B), 17 Indian, and 20 Peruvian (Figure 5A) strains with values outside the box shown as individual points. Mann–Whitney U-tests show significant differences (** p < 0.01; *** p < 0.001).
(G) Tests of strains from Sweden (n = 21,) Peru (n = 20), India (n = 17), Greece (n = 30), and Japan (n = 22) showed that acid sensitivity (pH50) correlates with Leb-binding capacity for the combined set (rs = −0.68, n = 110, p < 0.0001), see also Figure S7F.

