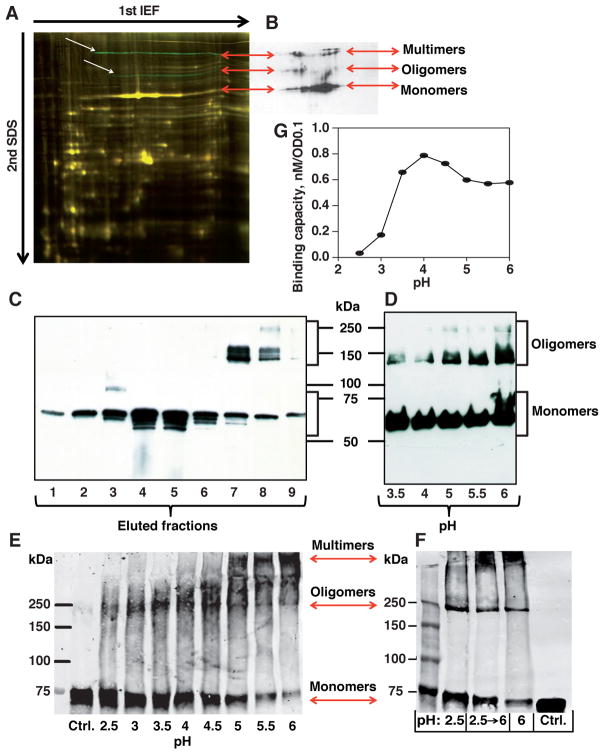
Figure 7. BabA Multimerization and Reversible Acid Dissociation.
(A) H. pylori J166 whole-protein extracts analyzed by 2D-DIGE. The two green bands (white arrows) that were missing or significantly reduced after 8 weeks of infection in a rhesus macaque (presumable BabA oligomers and multimers) were, together with the dominant yellow band that corresponds to the BabA monomer, positive for BabA by immunoblot (B) (see also differential fluorescence in Figure S7A).
(B) BabA immunoblot of J166 wild-type whole-protein extract separated by 2D-DIGE revealed three groups of bands – BabA monomer, oligomers, and HMM (double-band) multimers (arrows).
(C) Non-reducing SDS-PAGE of CEX fractions from BabA purification (Figure S2Ga). BabA eluted as a monomer followed by HMM oligomers and possible multimers.
(D) Non-reducing SDS-PAGE of ZW-12 detergent extracts of 17875/Leb bacterial cells in a pH range from 3.5 to 6. Acidification of the bacterial extract caused dissociation of BabA oligomers and multimers into monomers.
(E) Glutaraldehyde crosslinking of 17875/Leb bacterial cells after exposure to pH 2.5–6. Digital integration of the BabA fluoro-Infra-Red (IR)-signal is shown in Figure S7D.
(F) Glutaraldehyde crosslinking of 17875/Leb bacterial cells after exposure to pH 2.5 with BabA dissociation into monomers (pH 2.5); reconstitution of BabA into multimers by pH 6 reconditioning after prior pH 2.5 acidification (pH 2.5→6); and pH 6 exposure for visualization of the predominant multimers (pH 6). Digital integration of the BabA IR-signal is shown in Figure S7E.
(G) Correlation between acid dependence (pH50) and maximal Leb-binding capacity (as an approximation of active and available BabA adhesin protein) for 17875/Leb bacterial cells was estimated by equilibrium-in-binding affinity analysis.

