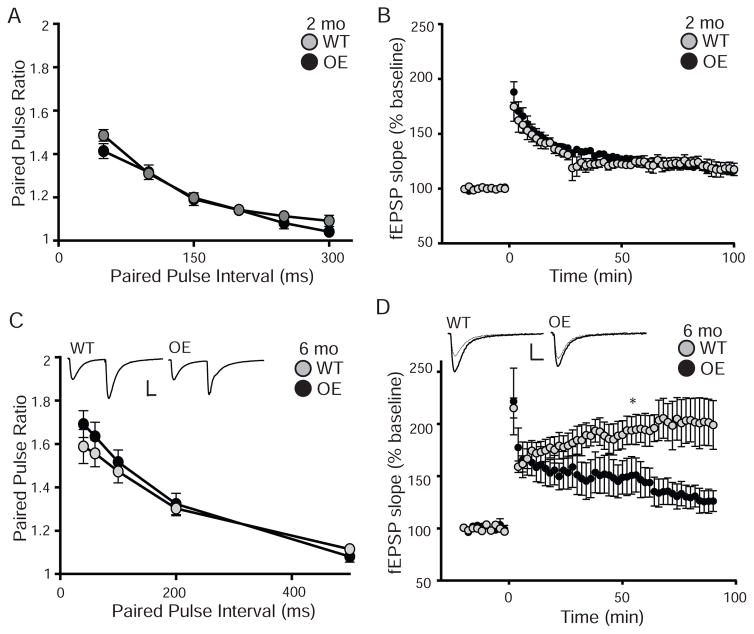
Figure 4. Overexpression of KL decreases long-term potentiation at 6 months.
A. Paired-pulse ratio from 2 month old WT and OE slices at intervals from 50–300 ms (7–10 mice/genotype and 5 slices/mouse) show no difference between genotypes. B. LTP measured as the fEPSP over time before and after induction stimulation from 2 month old WT and OE slices (6 mice/genotype and 5 slices/mouse) also show no difference between genotypes. C. Paired-pulse ratio from 6 month old WT and OE slices at intervals from 40–500ms show no difference between genotypes. Traces represent the 40ms interval. Scale bar is 10ms, 0.5mV (5–6 mice/genotype, 2–4 slices/mouse). D. 6month old WT/OE LTP as in B show no difference between genotypes (5–6 mice/genotype, 2–4 slices/brain). Representative traces represent 1min before (dashed line) and 60min after (solid line) stimulation. Scale bar is 10ms, 0.5mV. Statistical significance calculated 60 min after LTP induction. (Averaged data plotted as +/− S.E.M.; T-test: *p<0.05).

