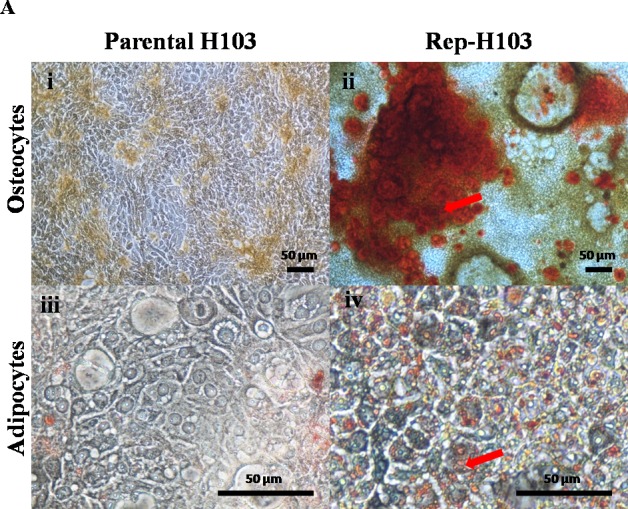
Figure 6. Directed differentiations into osteocytes and adipocytes.

(A-i) Control parental H103 cells showing negative for the Alizarin red staining (A-ii) H103 iPSCs like cells showing positive for the Alizarin red staining indicating calcium deposits (Red arrow). (A-iii) Negative staining for Oil-Red-O in control parental H103 cells. (A-iv) Adipogenesis induced lipid droplets observed red in colour stain after Oil-O-Red staining. (Red arrow) indicates the tiny lipid droplets. Nikon inverted microscope, original magnification: (A-i & ii) 10×, (A-iii & iv) 40×.
