
Figure 2.
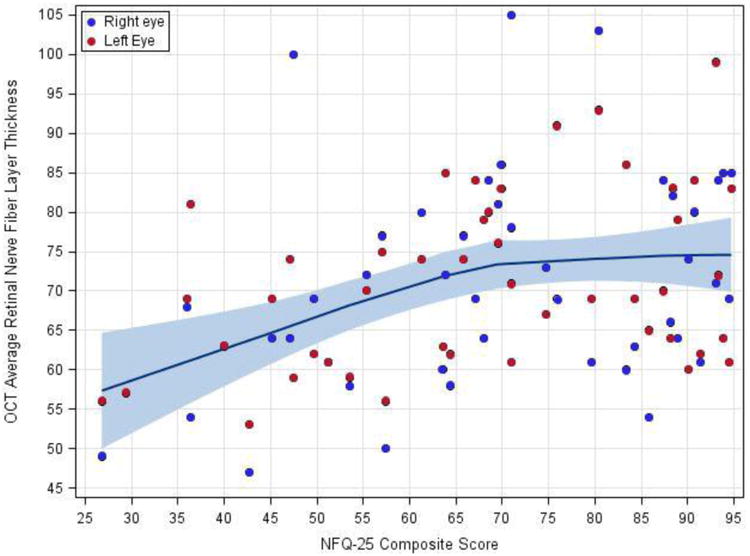
Relationship between retinal nerve fiber layer thickness and visual function quality of life.
Visual function quality of life score was plotted against RNFL thickness and a locally weighted regression line with a smoothing factor of 0.9 was calculated. Shading represents the 95% confidence interval for the smoothed line.