
Figure 3. Diagram to show the inter-relationships of the different models based on body composition used to predict basal metabolic rate (BMR) in C57BL/6 mice.
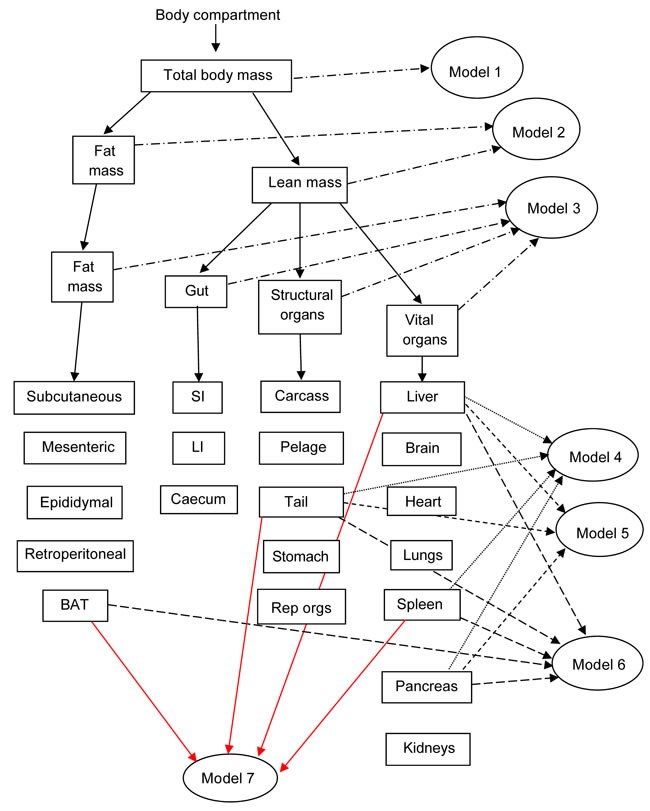
Models 1 to 3 are based on gross weights of whole body (Model 1), separated into lean and fat mass (Model 2), or separated into 4 compartments (vital organs, structural tissue, fat tissue and the gut) (Model 3). Models 4 to 7 include various combinations of the different tissue weights in regression models that minimize the Akaike information criterion. SI and LI refer to small and large intestine respectively.