
Figure 4.
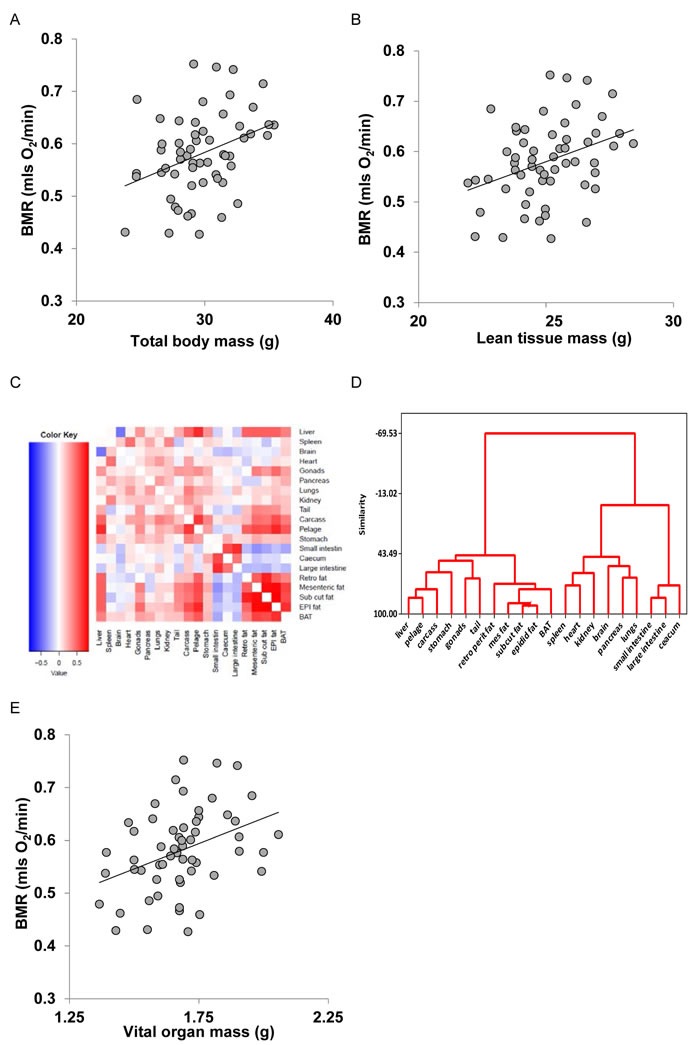
Basal metabolic rate (BMR) (mls O2/min) of 57 mice (strain C57BL/6) aged 5 months plotted against A. total body mass (g), B. lean body mass (g). C. correlation matrix between the masses of the different body components across 57 C57BL/6 mice used to construct models of basal metabolism. D. dendrogram derived from the correlation matrix in C., showing the groupings of the different tissues into 4 broad groups, and E: BMR (mls O2/min) plotted against mass of the summed vital organs (g). Fitted lines in figures A., B. and E. are least squares fit regressions. For details of statistics refer to text.