
Figure 5. Modeling basal metabolic rate (BMR) from organ composition.
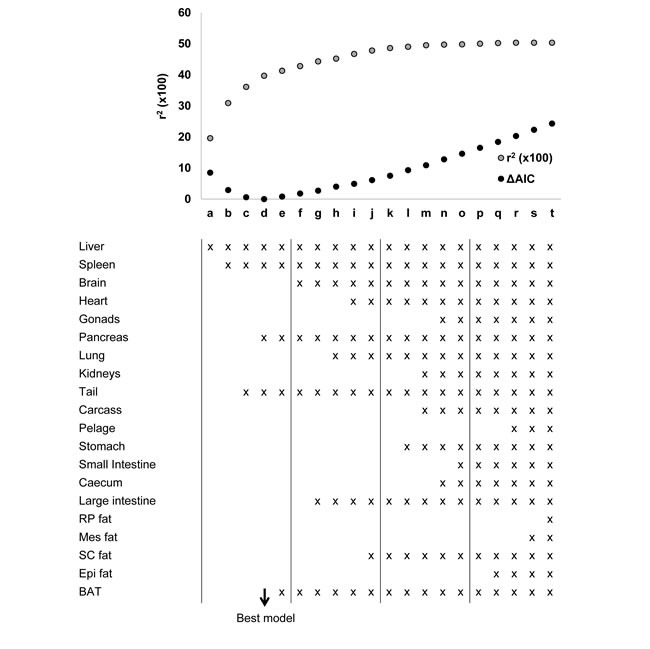
The plot shows the r2 (x100) (grey dots) and the delta Akaike information criterion (ΔAIC) (black dots) for each of 20 different models derived from stepwise regression performed by both backward elimination (models 4 to 20) and forward inclusion (models 1 to 4). The components of body composition included into each model are listed. Models 3, 4 and 5 minimized the ΔAIC and were used to predict metabolic rate of mice under calorie and protein restriction.