
Figure 8. Comparison of observed basal metabolism after calorie or protein restriction (CR and PR) and the predictions of Model 4 based on the body composition prediction model with the lowest AIC score (using masses of liver, spleen, tail and pancreas).
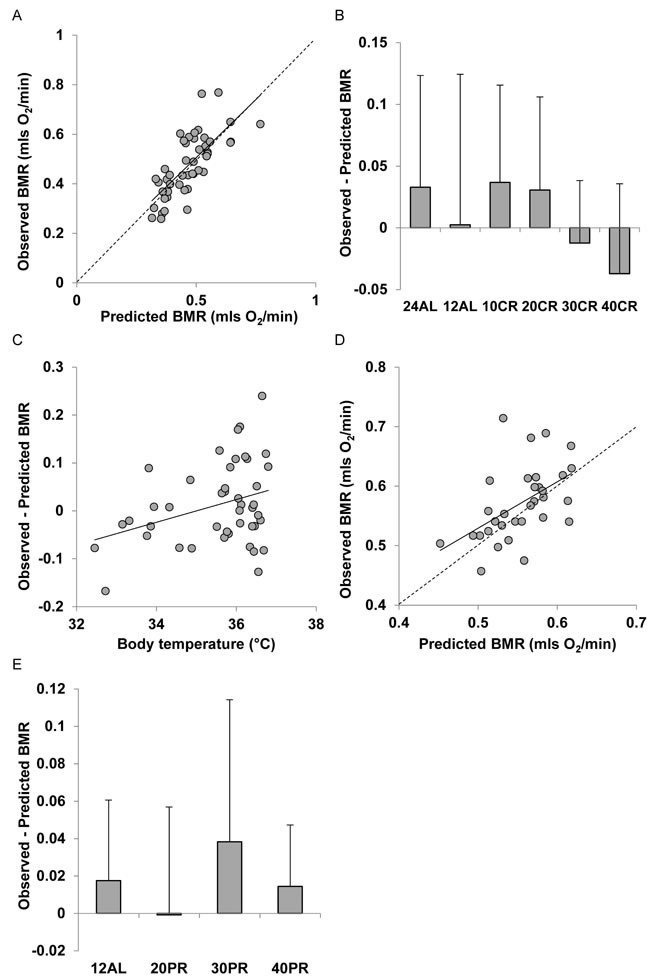
A. and D. basal metabolic rate (mls O2/min) observed after A. 3 months of CR and D. 3 months of PR plotted against the prediction using Model 4. Dashed line is line of equality and solid line is least squares fit regression (for details see text). Deviations of observed metabolic rate from the model prediction in relation to B., the level of CR and E. the level of PR. C. Relationship between the difference between the observed metabolism and that predicted from the model body temperature (°C).