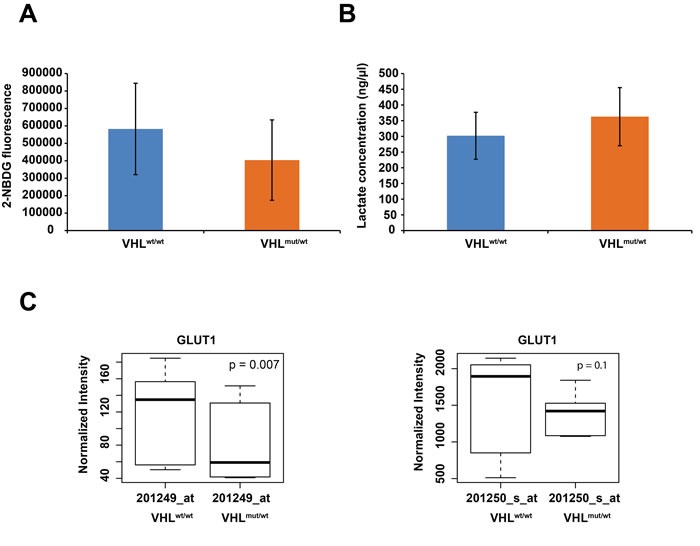
Figure 3.

A. Summary of averaged 2-NBDG fluorescence, indicating glucose uptake for 5 WT and 5 VHL-single hit cultures. B. Summary of averaged lactate concentration for 5 WT and 5 VHL-single hit cultures. C. Box plots of differential GLUT1 expression between VHLmut/wt vs. WT cells, as determined with indicated Affymetrix probes.
