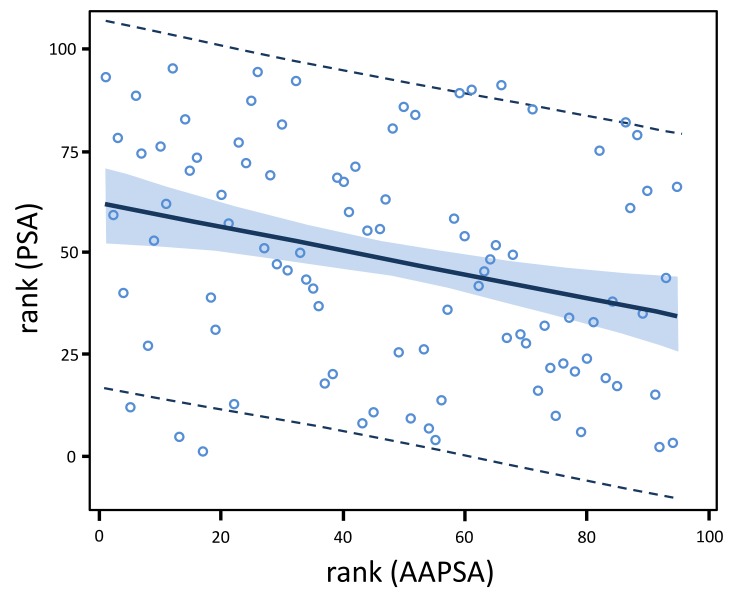
Figure 2. AAPSA reduces the level of serum PSA concentrations in men.
The linear regression model fit plot shows a negative association between PSA and AAPSA. The lines at the outer edges of the blue band define the 90% confidence limits for the mean of rank (PSA) for a given value of rank (AAPSA). The dashed lines define the 90% prediction limits for an individual value of rank (PSA) for a given value of rank (AAPSA). The fitted regression model for all 95 men combined is: rank (PSA ng/ml) = 61.812 - 0.288*rank (AAPSA μg/ml).

