
Figure 2. Comparison of an increased net change (Δ) of creatinine level between CKD-treatment and CKD-control groups with respect to the time intervals between baseline and 12th month, and mean summation of serial changes of creatinine level in CKD-treatment (n = 10) and CKD-control groups (n = 9).
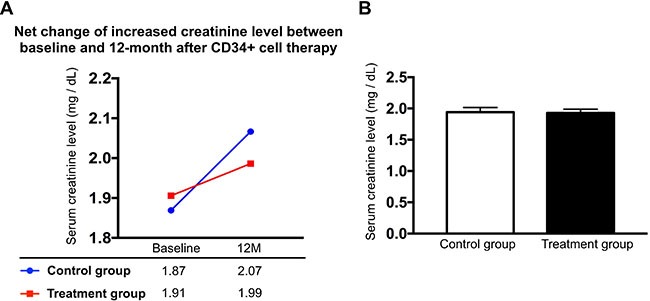
(A) An increase in net change of creatinine level (i.e., between baseline and 12th month) was noted little bit higher in CKD-control group than in CKD-treatment group. (B) Mean summation of serial changes of creatinine level, CKD-treatment vs. CKD-control, p = 0.866.