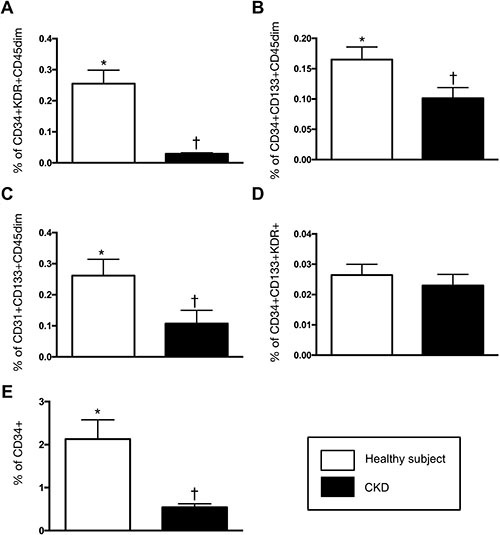
Figure 3. Comparison of circulating level of endothelial progenitor cells (EPCs) and hematopoietic stem cell (CD34+) between CDK (n = 10) and health-control (n = 10) groups.

(A) CD34+KDR+CD45dim (%), * vs. †, p < 0.0001. (B) CD34+CD133+CD45 dim (%), * vs. †, p < 0.002. (C) CD31+CD133+CD45 dim (%), * vs. †, p0.017. (D) CD34+CD133+KDR+ (%), CKD vs. health subjects, p = 0.255. (E) CD34+ (%), * vs. †, p0.002. All statistical analyses were performed by Wilcoxon's rank sum test.
