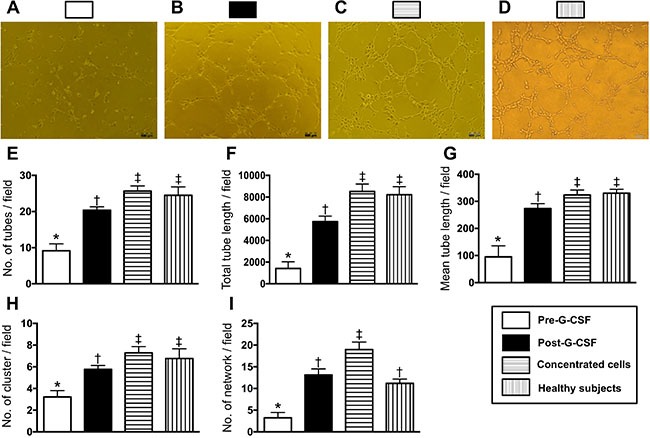
Figure 5. Angiogenesis capacity among the health-subjects and CDK-treatment patients prior to and after receiving granulocyte-colony stimulating factor (G-CSF) therapy.

(A to D) Illustrating the results of Matrigel assay of angiogenesis ability in CKD-treatment group prior to (A) and after G-CSF treatment (B) and from isolation of concentrated CD34+ cells (C), and in health-subjects (D), respectively. (E) Number of tubular formation, * vs. other groups with different symbols (†, ‡)p < 0.001. (F) Total tubular length, * vs. other groups with different symbols (†, ‡)p < 0.0001. (G) Mean tubular length, * vs. other groups with different symbols (†, ‡), p < 0.0001. (H) Number of cluster formation, * vs. other groups with different symbols (†, ‡)p < 0.001. (I) Number of network formation, * vs. other groups with different symbols (†, ‡)p < 0.001. Statistical analysis using Friedman test followed by Wilcoxon's signed-rank test with multiple comparison procedure. Symbols (*, †, ‡) indicate significance (at 0.05 level).
