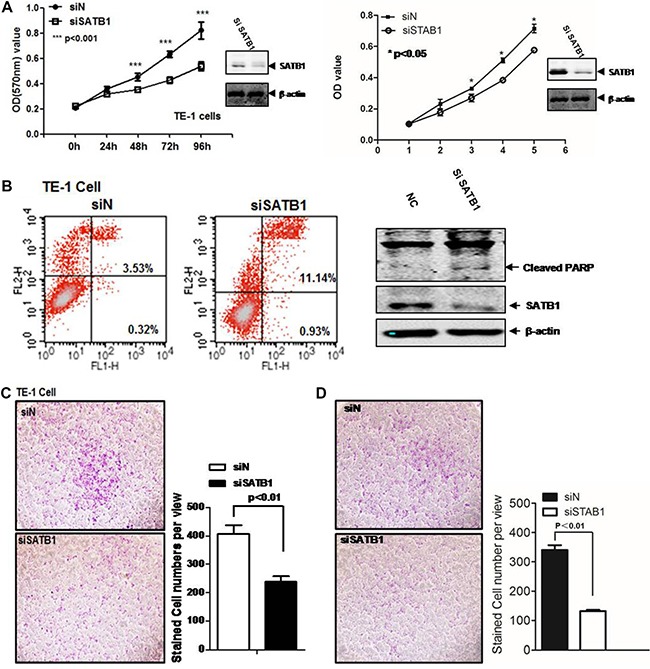
Figure 1. SATB1 promotes TE-1 and EC-109 cell survival and migration.

(A) MTT is employed to measure the cell viability in TE-1 and EC-109 cells. siN is the siRNA pool for control and siSATB1 is siRNA pool for SATB1; (B) Flow cytometry was performed to analyze the cell apoptosis. FL1-H is annexin V and FL2-H is PI. Western blot was performed to detect the cleaved PARP. Cell invasion/migration was evaluated by Transwell assays for (C) TE-1 cells and (D) EC-109 cells. The results are the mean ± SEM of three independent experiments.
