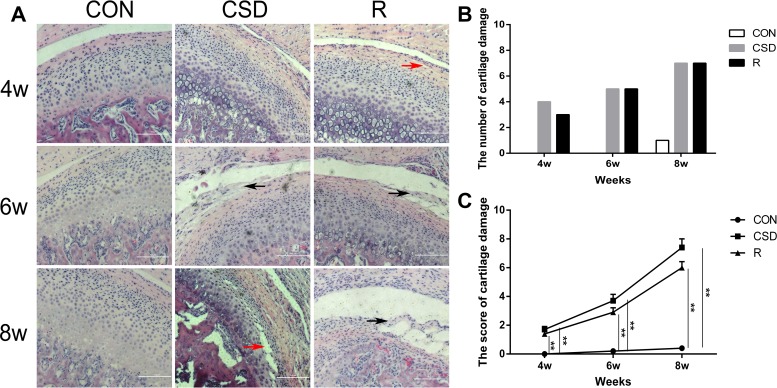
Figure 2. Rat TMJ sections stained with hematoxylin and eosin.
(A) Central condyles of the CON, CSD and recovery group at 4, 6, 8 weeks after sleep disturbance (original magnification: ×200, scale bar = 100 μm). (B) The number of cartilage damage for rats in the CON, CSD and recovery group (n = 10 per group) at 4, 6, 8 weeks after sleep disturbance. (C) The score of cartilage damage in the CON, CSD and recovery group (n = 10 per group) at 4, 6, 8 weeks after sleep disturbance. Bars represent the mean ± SD of each group. Significant differences between the groups are marked with asterisks (*P < 0.05, **P < 0.01). (R: group).

