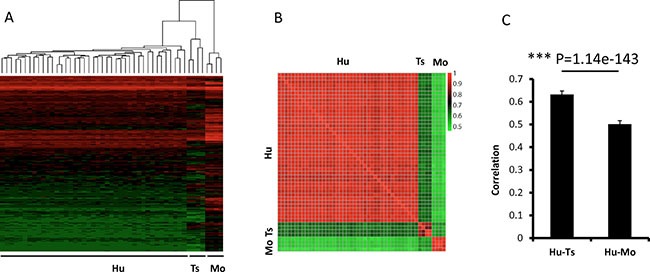
Figure 5. Pairwise comparisons of the gene expression profiles among tree shrew, human, and mouse glioblastomas.

The dendrogram (A) show 3 clear clusters of tree shrew, human, and mouse samples. The heatmap (B) illustrates the correlation of the expression profiles from the 3 species. The bar (C) illustrates the average correlation between the 3 species. The error bars show the standard deviations. The Red/green values represent Pearson Correlation Coefficient between the heatmap. Hu:human; Ts: tree shrew; Mo: mouse.
