Figure 1.

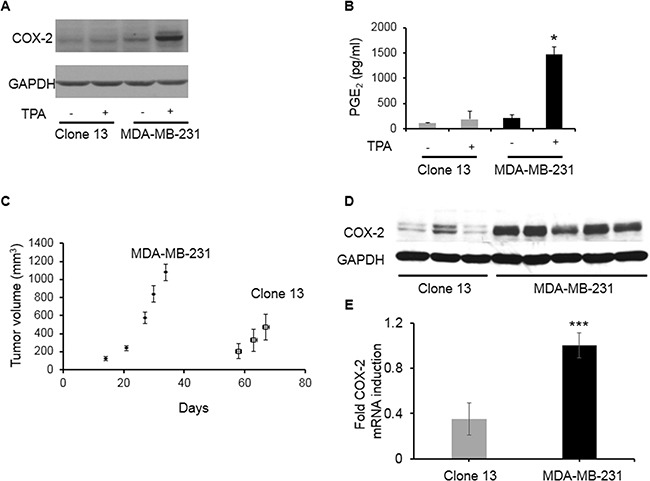
A. COX-2 expression in cells. B. PGE2 expression in cells; cells were exposed to 50 nM TPA for 24 h to induce COX-2 expression. C. Tumor volumes for COX-2 containing parental MDA-MB-231 (N=5) and COX-2 reduced Clone 13 (N=8) tumors; 2 × 10⁶ cells were inoculated in 0.1 ml of 8.8 mg/ml Matrigel. D. Representative immunoblot showing COX-2 expression in MDA-MB-231 and Clone 13 tumors. GAPDH was used as loading control. E. Relative fold change in COX-2 mRNA levels in MDA-MB-231 (N=6) and Clone 13 (N=4) tumors. Values represent Mean ± SEM. *p ≤ 0.05; ***p ≤ 0.001 using ΔCt values.
