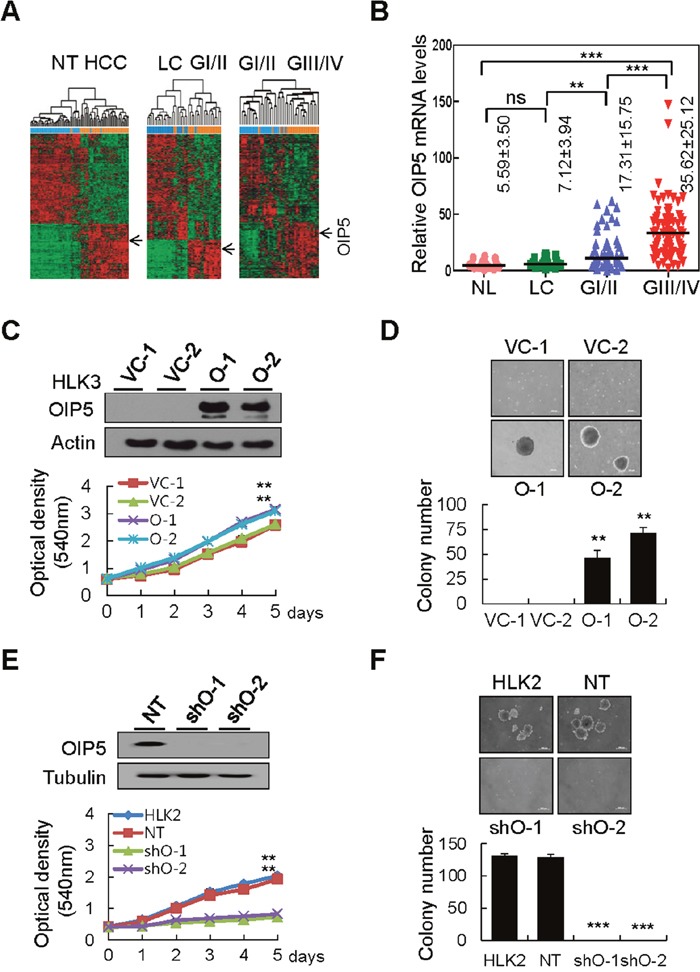
Figure 1. OIP5 expression in HCC tissues and cell lines modulates tumor cell growth.

A. Unsupervised hierarchical clustering separated the samples into two main groups: a non-tumor group (NT; normal liver + liver cirrhosis, n = 42) and an HCC group (GI/II + GIII/IV, n = 42). Two subgroups were also present: a liver cirrhosis group (LC, n = 21) and a well-differentiated HCC group (GI/II, n = 21); a well-differentiated HCC group (GI/II, n = 21) and a poorly differentiated HCC group (GIII/IV, n = 21). OIP5 was a unique gene with a two-fold or greater difference in expression from the mean at P < 0.05 based on the t-test for hierarchical clustering analysis. B. OIP5 mRNA levels were determined by real-time RT-PCR in four relevant groups of samples: normal liver (NL, n = 16), liver cirrhosis (LC, n = 19), Edmondson grade I/II (GI/II, n = 58), and Edmondson grade III/IV (GIII/IV, n = 74). Bars indicate medians. Values represent mean ± SD. P values represent the results of Mann-Whitney U tests. The Kruskal-Wallis test was used for overall comparisons. **P < 0.01; ***P < 0.001. C. OIP5 expression in HLK3 cells (O) stably transfected with OIP5 expression plasmid evaluated via Western blot (upper panels). The proliferation of OIP5-expressing transfectants was evaluated by MTT assay (lower panels). Absorbance of the solution was measured at 540 nm. Triplicate experiments with quadruplicate samples were performed. The values represent the mean ± SD. **P < 0.01. VC, vector control. D. Soft agar colony formation assay on OIP5-expressing HLK3 cells. The colonies shown are two weeks old. Scale bar: 200 μm (upper panels). Quantification of colony formation (lower panels). Each bar represents the mean ± SD (n = 3). **P < 0.01. E. Knockdown of OIP5 (shO) by lentiviral delivery of OIP5 shRNA, evaluated by Western blot (upper panels). The proliferation of HLK2 cells with OIP5 knockdown was evaluated by MTT assay (lower panels). **P < 0.01. NT, nontarget. F. Soft agar colony formation assay of HLK2 cells with OIP5 knockdown (upper panels). Scale bar: 200 μm. Quantification of colony formation (lower panels). Each bar represents the mean ± SD (n = 3). ***P < 0.001.
