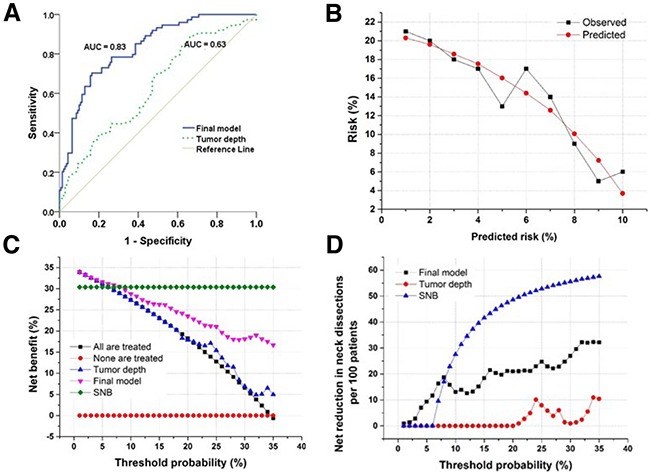
Figure 3. Evaluation of the predictive model and decision curve analysis.

A. Receiver operating curve demonstrating the difference in discriminating between patients with and without occult lymph node metastases based on the final predictive model or tumor depth. The final model is significantly better at discrimination than using tumor invasive depth as a marker. B. Calibration plot of the final model showing good agreement between observed and predicted probabilities (P = 0.4, Hosmer-Lemeshow goodness-of-fit). C. Decision curve analysis demonstrating the net benefit associated with performing neck dissection based on the markers listed in the figure. Threshold probability is the specific probability of having occult lymph node metastases at which a clinician would choose to perform a neck dissection. The highest curve at any given threshold is the optimal decision-making strategy to maximize net benefit. D. Decision curve analysis demonstrating the net reduction in performing neck dissections based on the markers listed in the figure. In the range of relevant threshold probabilities the final model leads to a large reduction in unnecessary neck dissections compared to using tumor depth to evaluate presence of lymph node metastases.
