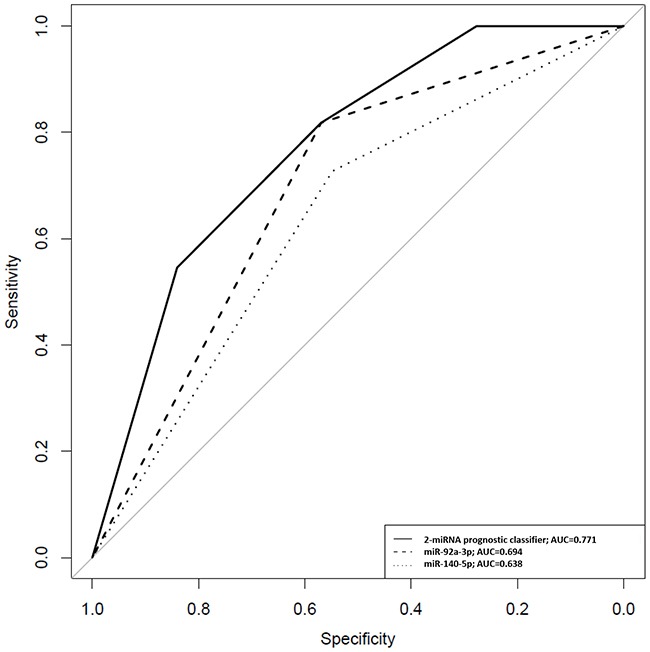
Figure 1. ROC curves for miR-140-5p, miR-92a-3p and the 2-miRNA prognostic classifier based on results obtained by quantitative PCR in urinary samples of NMIBC patients.

A RS for tumour progression was calculated for each patient according to a mathematical algorithm containing miR-140-5p and miR-92a-3p expression values as described in Patients and methods section. In this equation, miR-140-5p and miR-92a-3p were introduced as dichotomous variables (miR-140-5p expression ≥-4.4=1; <-4.4=0 and miR-92a-3p expression ≥-0.555=1; <-0.555=0). At fixed sensitivity of 80%, specificity for miR-140-5p and miR-92a-3p individually and combined in the 2-miRNA classifier was 32%, 38% and 59%, respectively.
