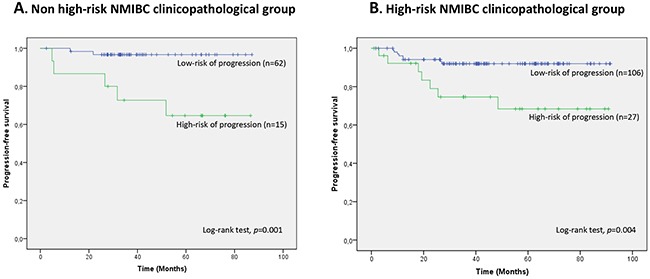
Figure 3. Kaplan-Meier curves for the two-miRNA prognostic classifier showing time to progression in clinicopathological groups of risk.

A. non high-risk NMIBC (n=77) and B. high-risk NMIBC (n=133) patients. Patients were divided within each clinicopathological NMIBC risk group according to their RS (RS<1.62, low-risk of progression; RS>1.62, high-risk of progression).
