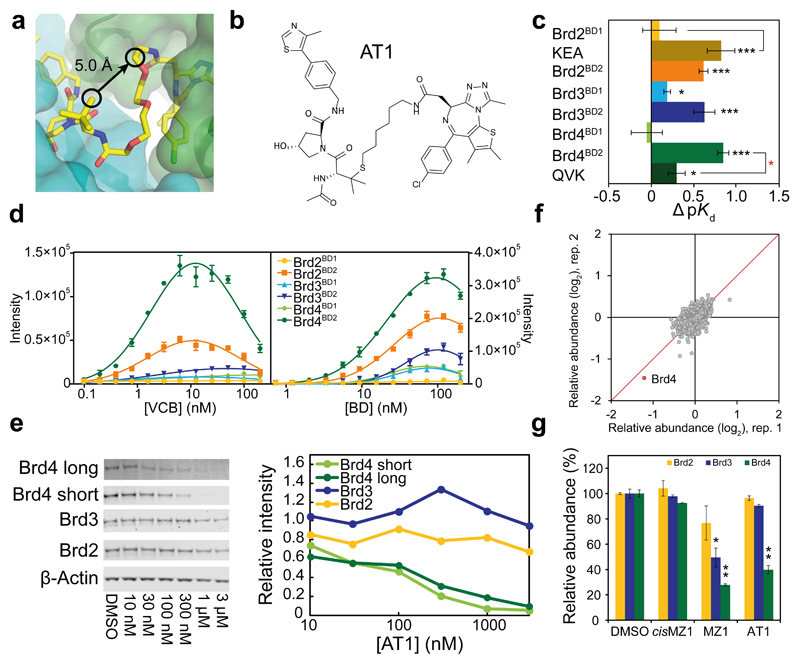
Figure 4. Structure-guided design and characterization of Brd4-selective degrader AT1.
a, A vector linking VH032 to JQ1 that maintains the relative binding orientation. b, Chemical structure of AT1. c, ΔpK d measured for VCB with AT1 and the indicated BET-BDs, reported as difference (± uncertainty), from pKd values measured as mean (± 1 s.e.m.). Statistical significance of pKd values for ternary titrations compared to corresponding binary (black) and for ternary WT compared to corresponding mutant (red) was assessed by two-tailed t-test assuming equal variances. d, AlphaLISA intensity values titrating VCB against BET-BDs with AT1 (left) and BET-BDs against VCB with AT1 (right). AlphaLISA intensities are the mean (± 1 s.d.) of intensity values from four technical replicates. e–g, Highly selective degradation of Brd4 by AT1 in HeLa cells after 24 h. e, Protein levels are shown from one representative of three biological replicates, visualized by immunoblot (left) and quantified relative to DMSO (right). Intensity values were measured as described in Online Methods. Full gels are provided in Supplementary Fig. 11. f, Impact of AT1 (1 µM, 24 h) on the cellular proteome. Data plotted as fold change (log2) of replicate 1 vs replicate 2, for a total of 5,674 proteins quantified (see Online Methods). g, Quantified levels of BET proteins shown are mean (± 1 s.e.m.) from two replicates relative to mean of vehicle. Statistical significance of relative protein abundance compared to DMSO was assessed by two-tailed t-test assuming equal variances. Statistical significance indicated as * (p-value < 0.05), ** (p-value < 0.01) or *** (p-value < 0.001).

