
Figure 4. Specific strains induce astrocytic tau pathology.
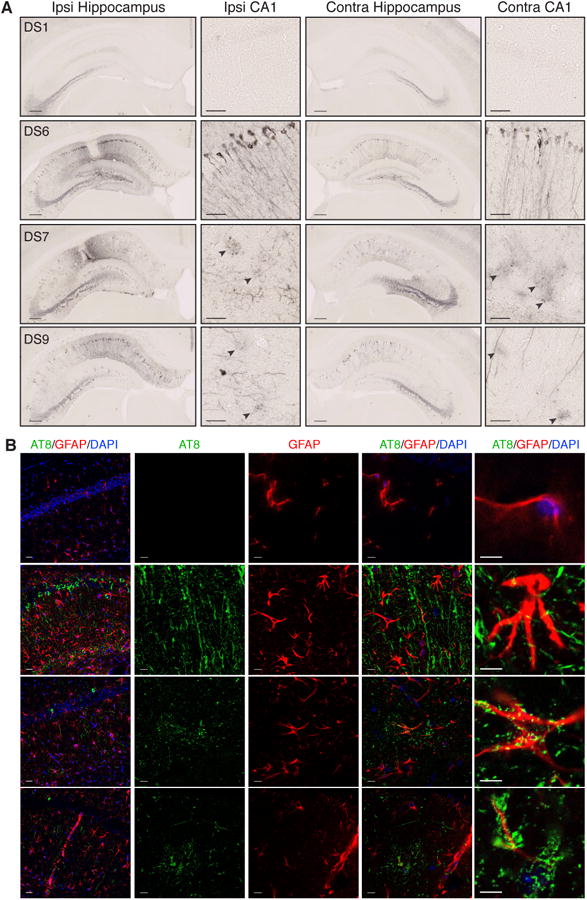
(A) AT8 tau pathology 8-weeks after injection with DS1, 6, 7, or 9. DS1 does not induce tau pathology. DS6, 7 and 9 develop strong AT8 staining in ipsilateral and contralateral hippocampi. DS7 and 9 develop diffuse, circular-shaped accumulations of AT8 staining that do not appear to localize to a neuronal cell body (black arrow heads). Scale bars represent 250 μm for the whole hippocampus, and 50 μm for CA1.
(B) Co-staining of AT8 (green) for phospho-tau, GFAP (red) for astrocytes, and DAPI (blue) for cell nuclei. DS1 shows limited GFAP staining, and no AT8 pathology. DS6 shows strong AT8 staining with limited overlap of AT8 staining. DS7 and 9 injected mice display astrocytic plaquelike pathology that either deposits within or around GFAP-positive processes of astrocytes. Scale bars represent 25 μm for left column, and 10 μm for all remaining images. For further quantification and representative images of other strains that display limited astrocytic plaque pathology, see Figure S4.