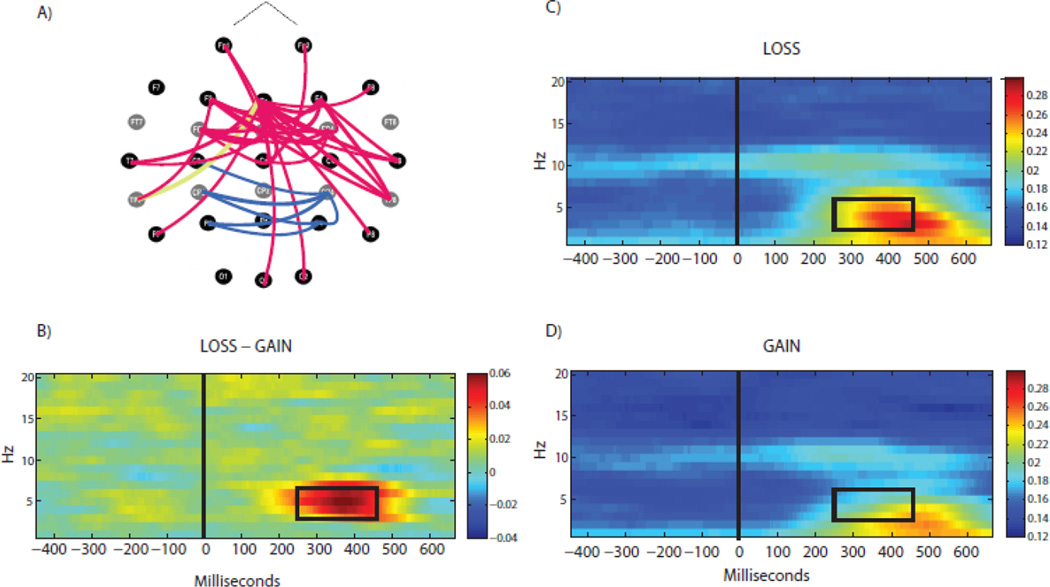
Fig. 2.
Large-scale synchronization of neuronal oscillations during feedback processing. (A) Topographical plot of inter-site phase coherence in the theta band (top view of the scalp, nose up) shows connections discriminating between Loss and Gain feedback (Red: Loss>Gain, Blue: Gain>Loss; Yellow: Loss>Gain for a representative Fz-TP7 pair). (B) Time-frequency plot of the Loss – Gain contrast (shown for a representative connection, Fz-TP7 pair) reveals a strong theta-band (3–7 Hz) response in the 250–450ms time window associated with prediction error. Each colored pixel represents inter-site phase coherence at specific time (X axis) and oscillation frequency (Y axis). Panels C and D show time-frequency coherence plots of responses to Gain and Loss feedback, respectively for the same electrode pair. Taken together, these plots show that a transient theta-response to loss feedback is a dominant feature of the large-scale network dynamics associated with action outcome processing, and negative outcomes are associated with an increase in connectivity between the frontal and parietal regions, with the mid-frontal site (Fz) being a “hub” showing the largest number of significant connections.

