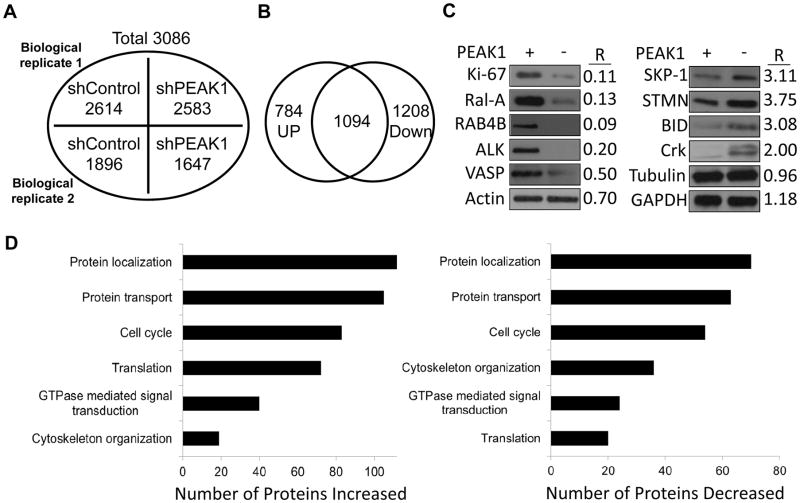
Figure 1.
Proteomic and informatic analyses of proteins changes in PEAK1 knockdown PDAC cells. (A) Total number of proteins identified in two independent biological replicates from shRNA control (shControl) or shRNA PEAK1 (shPEAK1) treated 779E cells. (B) Venn diagram showing the overlap of proteins significantly down- or up-regulated by eIF5A knockdown from two biological replicates. (C) Cell lysates from 779E cells expressing shControl (PEAK1+) or shPEAK1 (PEAK1-) were western blotted for the indicated proteins. R = ratio of shPEAK/shControl protein levels as quantified by LC/MS/MS. (D) Functional classification of proteins increased or (E) decreased by shPEAK1 knockdown based on Gene Ontology (GO) analysis.

