Figure 6.
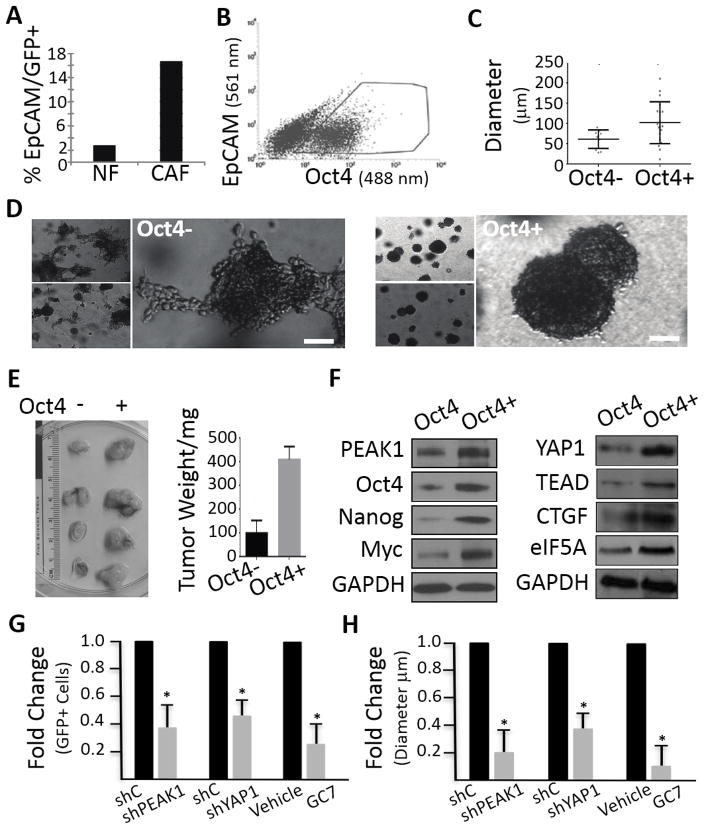
eIF5A-PEAK1-YAP1 signaling in Oct4 reporter PDAC cells. (A) FG cells expressing GFP fused to the Oct4 promoter were analysed for expression changes in co-cultures with normal human fibroblasts (NF) or freshly isolated cancer-associated fibroblasts (CAFs) derived from PDAC patients as described in supplementary Materials and Methods. The percentage of cells expressing both the Oct4 reporter (GFP+) and the epithelial marker (EpCAM+) were detemined for each of the co-cultures by FACS. (B) Representative FACS profile and gating used for the enrichment of FG cells expressing the GFP-Oct4 reporter in traditional 2D cultures. (C) The size of tumor spheres in 3D cultures was determined for GFP-Oct4+ and GFP-Oct4- cell populations isolated as in B. (D) Representative phase contrast photomicrographs of GFP-Oct4+ and GFP-Oct4- cell populations in 3D cultures. Bar = 20μm. Note that GFP-Oct4+ cells form round compact spheres, whereas GFP-Oct4- cells form smaller and loosely adherent, disorganized cell-cell clusters. (E) Tumor size in mice was determined for GFP-Oct4+ and GFP-Oct4- cell populations isolated as in B. p<0.05 by Student t test. (F) Western blots for the indicated proteins from GFP-Oct4+ and GFP-Oct4- cell populations isolated as in B. (G) FG cells expressing the GFP-Oct4 promoter reporter and depleted of PEAK1 (shPEAK1), YAP1 (shYAP1), or treated with GC7 were examined for changes in the percentage of GFP+ cells by FACS relative to control cells treated with non-specific shRNAs (shC) or drug vehicle. * p< 0.01 Student t test. (H) GFP-Oct4+ and GFP-Oct4- cells treated as in G and examined for changes in sphere diameter. Fold changes are relative to shControl and vehicle treat cells as in G. * p< 0.01 Student t test.

