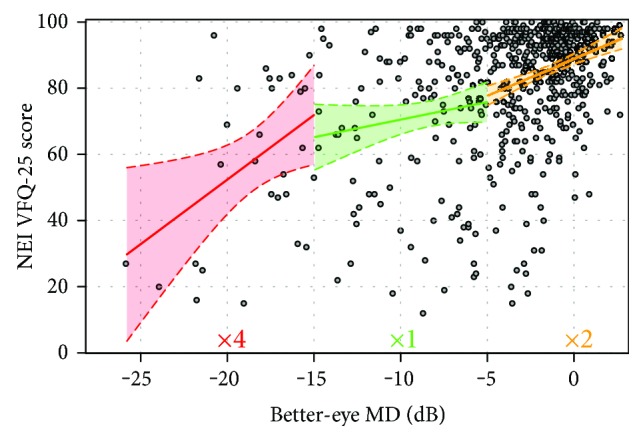
Figure 2.

Fitting of three OLSR lines with 95% confidence limits for each phase of decline in VRQL. Points represent scores on the NEI VFQ-25 and BEMD in 636 patients. The green phase shows the slowest decline in NEI VFQ-25 score; the yellow line shows quicker decline where NEI VFQ-25 scores reduce 2 times faster than that in the green phase. The red line shows decline on NEI VFQ-25 as about four times quicker than that in the green phase.
