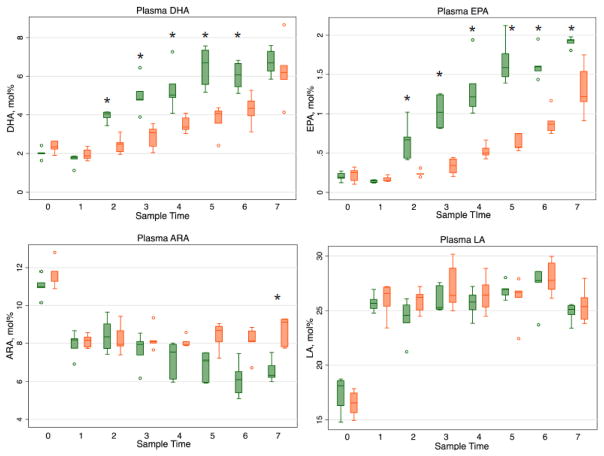
Figure 1.
Plasma fatty acid profiles (mol%) in DHA-ALT® (green) versus Control (orange) groups. Data represented as longitudinal box and whisker plots with line at the median value. DHA: Docosahexaenoic acid; EPA: Eicosapentaenoic acid; ARA: Arachidonic acid, LA, Linoleic acid. Sample time 0= day of surgery; 1= postoperative day (POD) 1/AM; 2=POD 1/PM; 3=POD 2/AM; 4= POD 2/PM; 5=POD 3/AM; 6= POD 3/PM; 7= POD 4/AM. *p< 0.05.

