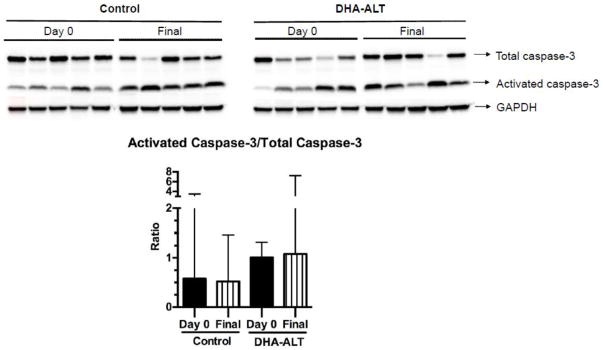
Figure 4.
Comparison of activated caspase-3/Total caspase-3 ratios in Day 0 and Final samples in the two treatment groups. The western blot is shown for Day 0 and Final time points in each treatment arm (n=5 in each group). Densitometric quantification (median ± IQR) of the western blot data is shown. Black bars represent Day 0 samples; Striped white bars represent Final samples.

