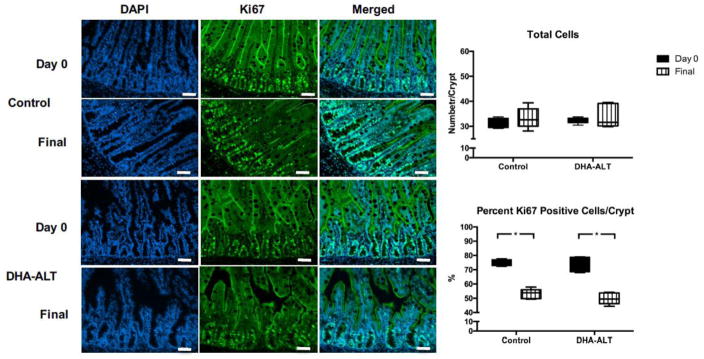
Figure 5.
Ki67 immunofluorescence with quantification. Immunofluorescence for DAPI (total nuclear staining), Ki67, and the merged images are shown. White bar in lower right corner of images = 50 μM. In the right panel, total nuclei cell count per crypt and percent ki67 positive cells per crypt are shown as box and whisker plots with a line at the median value. Black bars represent Day 0 samples; striped white bars represent Final samples. *p< 0.05.

