
Fig. 11.
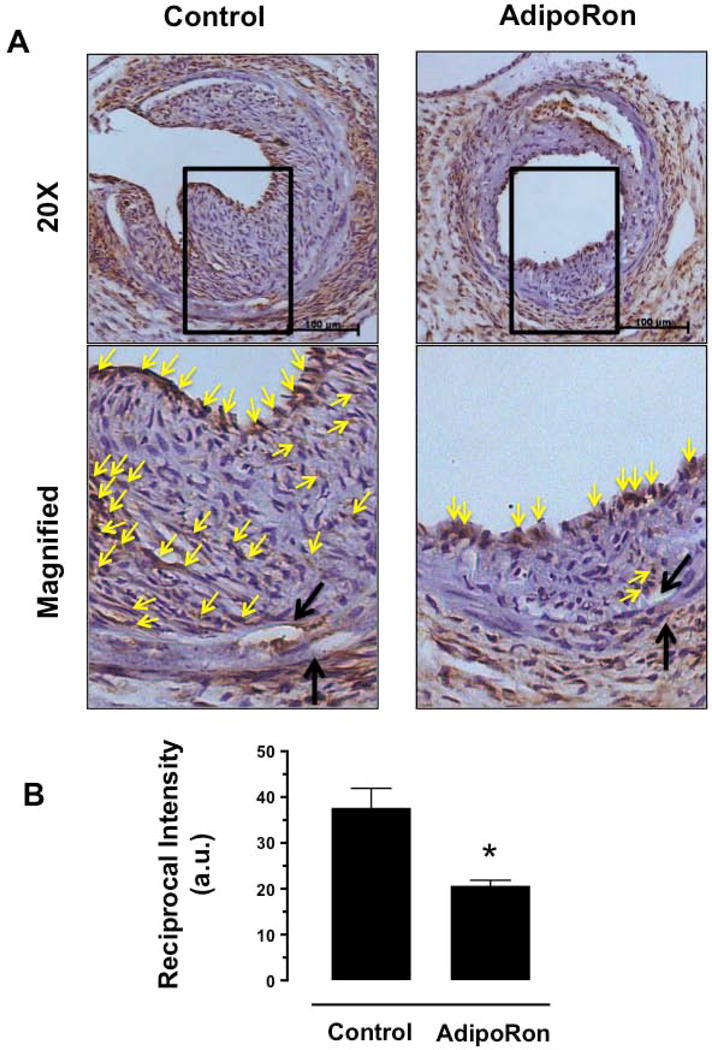
Effects of AdipoRon on the phosphorylation state of S6 ribosomal protein in the injury femoral artery. The femoral artery sections from AdipoRon-treated and control mice were subjected to immunohistochemical analysis using primary antibody specific for pS6. A) The representative images of pS6 immunoreactivity were visualized using diaminobenzidine (DAB) staining at a magnification 20x. The scale bars represent 100 μm (upper panel). Black arrows indicate internal and external elastic laminae; yellow arrows indicate pS6 (lower panel). B) The intensity of pS6 staining was quantified and expressed as reciprocal intensities. The data shown in the bar graph are the means ± SEM. * p < 0.05 using unpaired t-test (n = 3). a. u. = arbitrary units.