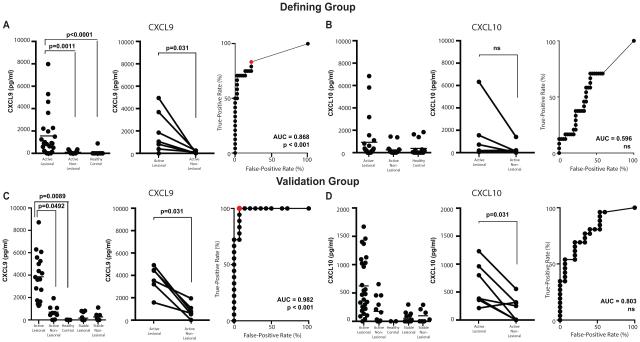
Figure 3. Chemokine Protein Levels in Blister Fluid.
Quantification of CXCL9 or CXCL10 in the blister fluid of the defining group (A and B, respectively) and validation group (C and D). Each panel is organized in the following manner: quantification by individual sample (left), paired analysis of vitiligo subjects (lesional vs non-lesional blister, middle panel), and ROC curve (right). Red dots mark threshold values described in the text.

